
February 2023 Vol. 78 No. 2
Features
CIGMAT Focuses Research on Real-Time Monitoring
(UI) — Real-time monitoring of materials mixing, various critical processes during construction, entire service life of various infrastructures, and detecting and quantifying corrosion for maintenance are some of the main focus areas of CIGMAT.
The research studies and various presentations at conferences and workshops are related to oil, gas, water and wastewater infrastructures, bridges, foundations, pipelines and grouted soils. Additional interests include recycling of wastewaters, recycling of plastics, recycling of waste materials, treating contaminated soils and the impact of COVID-19 virus.
The goals are achieved by developing new highly sensing smart materials integrated with real-time monitoring and wireless transferring for construction, maintenance, repairs and detecting gas, oil and water leaks using the recently received U.S. Patent on “Chemo-Thermo-Piezoresistive Highly Sensing Smart Cement with Integrated Real-Time Monitoring System” (Number 10,481,143).
Current CIGMAT projects are developing real-time monitoring systems for both laboratory research and field applications related to both onshore and offshore. Some of the studies are focused on monitoring field performances (smart cemented well, bridges supported on deep foundations); developing and characterizing smart cements, smart grouts and smart drilling muds for oil well and water well construction and cementing; ultra-deepwater pipe-soil interaction; and joint leak testing of stormwater pipes.
Other studies include detection and quantification of corrosion, which recently received a U.S. Patent on “Rapid Detection and Quantification of Surface and Bulk Corrosion and Erosion in Metallic and Non-metallic Materials with Integrated Monitoring System” (Number 10,690,586), application of nanotechnology, and environmental issues.
CIGMAT researchers have developed unique testing facilities, such as high-pressure and high-temperature (HPHT) testing of materials for oil and gas infrastructure applications, and test protocols approved by the U.S. Environmental Protection Agency to test grouts and coatings for infrastructure rehabilitation. In addition, the Life Cycle Cost model (CIGMAT-LCC) for wastewater systems is being used by cities, counties and the public.
Over the past two decades, over five dozen commercial products including rapid repair materials, coatings, grouts, liners, cementitious and polymer composites and pipes, have been researched and tested for a number of applications. Microbial fuel cell technology is being further developed to treat both oily waste and recycle highly salty fracturing fluids. Also, the observed trends are analytically and numerically modeled to better understand the influence of various types of organic and inorganic contaminants and environmental parameters with the field operating conditions.
The Vipulanandan rheological model, Vipulanandan failure model, Vipulanandan fluid flow model and Vipulanandan fluid loss mode are being verified with CIGMAT test results and data available in the literature. Every effort is made by the CIGMAT researchers to transfer technology from control studies to actual applications.
For real-time monitoring of the materials and infrastructures performances in the field, it is very important to identify the material electrical property that can be selected for monitoring. At the CIGMAT research laboratory a new material characterization model has been developed using the two probes with the impedance-frequency response and the Vipulanandan Impedance Model to identify the critical property that can be selected for monitoring. At present, this method is being used to characterize various natural and human made materials including fluids.
Ongoing research at CIGMAT is funded by federal, state and local agencies and industries. CIGMAT is working on a U.S. Department of Energy (DOE) and National Science Foundation (NSF)-I Corp funded projects on broadening and commercializing the applications of smart cement and smart drilling mud for real-time monitoring of oil well installation and performance during the entire service life but also in civil infrastructure applications.
Also, smart cement is being used as the binder in developing and characterizing concrete. Several systems are being developed, integrated with artificial neural network (ANN), to monitor the performance of the cement sheath that is embedded between the casing and geological formations.
Example Study: Smart Spacer Fluid Modified with Iron Oxide Nanoparticles for Cleaning Bentonite Clay Contamination
Real-time monitoring of the performance of materials used in oil, gas and water vertical wells construction and horizontal direction drilling (HDD), for installing pipelines are gaining importance over time.
With increasing demand for installation of various oil and gas pipelines, the industry is forced to drill to greater depths, reaching about 30,000 feet. Advancements in integrating vertical drilling with horizontal drilling have enabled the oil and gas industry to expand to many inaccessible areas around the world.
In the construction of an oil well, first, a wellbore is drilled, and a metal casing is placed inside of it. Spacer fluid is pushed inside through the casing out into the annulus for cleaning the casing of any drilling fluids residue. Spacer fluids have been primarily developed to separate the cement slurry from the drilling fluid because contamination affects the cementing operation and long-term stability of the cemented wells.
In HDD, the boreholes have to be cleaned during installation of the pipelines. Critical issues to consider are effective removal of the drilling fluids and associated residues from the wellbore prior to the completion of wells and installing the pipelines.
The quality of the cementing job strongly depends on the cleaning efficiency of the spacer fluid in removing, not only the drilling fluid with the cuttings, but also the filter cakes during the drilling operation. Based on the application, different types of spacer fluids are used with varying material properties, such as density, rheology and cleaning efficiency.
Cleaning efficiency of spacer fluids currently cannot be obtained in the field and, hence, needs more reliable methods for real-time monitoring. New parameters have to be investigated to quantify the cleaning efficiency and its performance in the field.
Selecting the proper spacer fluid is typically important and is dependent on the chemistry of the drilling fluid, its composition and conditions of the drilled holes. Spacer fluids play a crucial role in proper displacement of the drilling mud and removal of the filter cake developed along the drilled holes.
Various types of spacer systems are available in the oil and gas industry but may not be suitable for changing geological conditions along the drilled holes. Generally, a spacer fluid is composed of the following components:
- Water/oil as the base fluid
- Weighting materials to increase the density
- Rheological modification agent or polymers
- Proper surfactant package
Using these components makes the spacer density and rheological properties fall in-between the density and rheological profile of drilling fluid and cement.
In recent years, operators are exploring and producing from increasingly more difficult environments. Fluid displacements in offshore environments require spacer fluids to perform more than one operation effectively at low and high temperatures encountered in the well.
In each of these cases a novel design is needed to adjust for different conditions. Use of nanoparticles in a spacer system can provide enhancements in rheological, thermal, mechanical, magnetic and optical profiles.
Nanoparticles with noticeable alterations in the optical, magnetic field strength and electrical properties are excellent tools for the development of sensors and the formation of imaging contrast. Since the nanoparticles are extremely small in size, they are preferred because their abrasive forces are negligible, with less kinetic energy impact.
The overall objective of this study was to develop and characterize highly sensing smart spacer fluid with nanoFe2O3 for insitu electrical sensing and property modifications, under application of different pressures.
Specifically, the objectives were to:
- Design spacer fluid with higher cleaning efficiency (>95%) of oil-based drilling fluid contamination using iron nanoparticles and investigate the effects of magnetic field and temperature on the sensing and rheology property modifications.
- Characterize the spacer fluid to identify the critical electrical property for real-time monitoring.
- Model the rheological and cleaning efficiency of the spacer fluids using Vipulanandan Models.
Materials and Methods
The UH biosurfactant used in this study was produced from waste oil with acclimated bacteria in continuously stirred batch reactor. The critical micelle concentration (CMC) for this biosurfactant is 0.5 g/L and the surface tension reduces to 30 dynes/cm. The biosurfactant is water-soluble and based on Fourier Transform Infra Read (FTIR) spectroscopy analyses; both carboxyl (COO-) and hydroxide (OH-) groups were identified in the biosurfactant.
Diesel oil, representing the oil-based drilling fluid, with a density of 5.6 ppg, was used for the cleaning efficiency test. The resistivity of the oil was greater than 1000 Ωm.
Spacer fluid preparation used water as the base fluid. Rheology modifiers, such as Guargum up to 1% and UH biosurfactant up to 0.4%, were added. Also up to 3% KCl was added with the weighting agent lead nitrate (Pb(NO3)2).
KCl was first mixed with water, thoroughly, until it completely dissolved. Then rheology modifier Guargum was added, followed by the UH Bio-surfactant, and mixed until a uniform solution was obtained. This was then mixed with the weighting agent to obtain the spacer fluid.
Nano Iron was also added to the spacer fluid to enhance the performance with pressure, temperature and magnetic field. The fluid was characterized with electrical resistivity and density measurements at each stage of mixing.
Density testing plays a major role in providing the needed hydrostatic pressure in the drilled holes. Density of the spacer fluid with and without Nano Iron was measured immediately after mixing, using the standard mud balance cup.
HPHT testing of the spacer fluid went up to 500 psi. The change in the bulk resistivity of the material with the applied pressures was measured and modelled using the Vipulanandan model.
Rheological properties determine the pump ability and cleaning capability of the spacer. Rheology tests for smart spacer fluid with different contents of Nanoiron (nanoFe2O3), at temperature of 25°C to 75°C and magnetic fields of 0 to 0.6T, used a viscometer in the speed range of 0.3 to 600 rpm (shear strain rate of 0.5 s-1 to 1024 s-1) and related shear stresses were recorded.
The speed accuracy of this device was 0.001 rpm. The temperature of the spacer was controlled to an accuracy of ±2°C. The viscometer was calibrated using several standard solutions. All the rheological tests were performed after 10 minutes of mixing the spacer solutions.
The cleaning efficiency test was performed on the spacer fluid to quantify the spacer’s ability to clean the diesel oil, representing the oil-based drilling fluid, using the following procedure:
- Viscometer cup and the spindle were cleaned and dried. The dry weight of the spindle was measured (W1).
- Viscometer cup was filled with diesel oil and the spindle was run for 10 minutes at 100 rpm. After 10 minutes, the viscometer spindle was weighed again with the contamination (W2).
- Spacer fluid was placed in the cup and the spindle was rotated again for 10 minutes at 100 rpm. The viscometer spindle was weighted again (W3). Also, the change in the electrical property of the cleaning spacer fluid was measured.
Modeling
The spacer fluid showed non-linear shear thinning behavior with a yield stress. Based on the test results, the following conditions have to be satisfied for the model to represent the observed behavior:
τ = τo when γ. = 0; and γ. j ∞ j τ = τ* (1)
Rheological models used for predicating the shear thinning behavior of spacer fluids are summarized below.
The Herschel-Bulkley model (Eqn. 2) defines a fluid with three parameters and can be represented mathematically as
τ = τo1 + k × (γ.)n (2)
where τ, τo1, γ., k and n represent the shear stress, yield stress, shear strain rate, correction parameter and flow behavior index, respectively. For τ < τo the material remains rigid. The model assumes that below the yield stress (τo), the slurry behaves as a rigid solid.
The exponent n describes the shear thinning and shear thickening behavior. Slurries are considered as shear thinning when n < 1 and shear thickening when n > 1.
when γ. j ∞ j τmax = ∞ (3)
Hence, the Herschel-Bulkley model doesn’t satisfy the upper limit condition for the shear stress limit.
The Vipulanandan Rheological Model relationship is as follows:
τ – τo2 = γ. / (C + D × γ.) (4)
where τ shear stress (Pa); τo2: yield stress (Pa); C (Pa. s)-1 and D (Pa)-1: are model parameters and γ.: shear strain rate (s-1).
Also, when γ. j ∞ j τmax = (1/D) + τo2 (5)
Hence, this model has a limit on the maximum shear stress; the slurry will produce at a relatively high rate of shear strains.
Cleaning efficiency of the spacer is calculated as follows:

where:
W1 = weight of the viscometer spindle before the test in gms,
W2 = weight of viscometer spindle with the contamination in gms and
W3 = weight of the viscometer spindle after the test in gms.
The relation between maximum shear stress capacity and cleaning efficiency for smart spacer fluid (Vipulanandan Cleaning Efficiency model) is given as follows:

where CE (%) = Cleaning efficiency in percentage, τmax = Maximum Shear Stress capacity of the spacer fluid (Pa), and E and F are the model parameters.
Piezoresistivity of the slurry is modeled using the Vipulanandan Correlation model and the relationship is as follows:
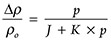
where (Δρ/ρo) is the change in bulk resistivity, p is the pressure applied, J and K are the model parameters.
Results and Discussion
Spacer fluid applications require the materials to be multifunctional. Hence, the spacer fluid must be modified or treated to enhance the different properties, such as density, rheology, cleaning efficiency, and sensitivity.
In this study, the water-based spacer fluid was modified with nanoFe2O3 for insitu sensing, property modifications, and to investigate the effect of magnetic field and temperature on the sensing property.
It is important to identify the critical electrical property that can be used to monitor the spacer fluids in the field during various applications. The electrical impedance-frequency response using the two probes and alternative current (AC), coupled with the Vipulanandan Impedance Model, was used to identify critical electrical property, such as inductance, capacitance (permittivity), resistance (resistivity) or a combination for the spacer fluids.
Identification of the most-appropriate equivalent circuit to represent the two-probe contacts and the electrical properties of the testing material, is essential to further understand its properties. In this study, an equivalent circuit to represent the smart spacer fluid was required for better characterization through the analyses of the Impedance Spetroscopy (IS) data.
Based on the testing results in this study, the typical impedance-frequency response and the equivalent electrical circuit are shown in FIGURE 1, which includes the two contacts and the bulk material (smart space fluid). This is also referenced as CASE 2-Reisitance Only, in the following.
The total impedance of the equivalent circuit for CASE-2 (Z2) is as follows:
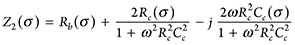
= R2 + j X2 (10)
The term R2 in Eqn. (3) represents the real part of the impedance (Zreal of Z2) and X2 represents the imaginary part of the impedance (Z2). When the frequency of the applied signal was very low, ω → 0, Z2 = R2 = Rb + 2Rc, and when it was very high, ω → ∞, Z2 = R2 = Rb, X2 will be equal to zero.
In CASE-2, if the impedance is measured at very high frequency, it will measure the resistance (Rb) in the material and eliminate the effects of the contacts; it is also frequency independent. This becomes another unique advancement in measurement and monitoring, since the resistance is independent of the very high frequency of measurement.
Also, changing spacer fluid conditions were monitored using the LCR meter at 300 kHz frequency to eliminate the contacts and measure the bulk spacer fluid resistance. The measured resistance was correlated to resistivity (material property), according to the conductivity probe and digital resistivity meter.
In the field, it will be easier to monitor the electrical resistance (R), but it is not a material property. And cement is not a conductive material, such as metals. Hence, from past studies and theoretical understanding of electrical resistivity (ρ), the following relationship between resistivity and resistance was used and experimentally verified:
ρ = R / K + GR (11)
Both material parameters K and G are determined using experiments, while ρ and R are measured independently. Several experimental studies were performed to determine the parameters K and G for the smart spacer fluids.
Based on the studies, it was proven that parameter G was zero for smart spacer fluids. Therefore, changes in resistivity (dρ) can be related to the change in resistance (dR), represented in Eqn. (11), as follows (parameter G = 0):
(dρ / ρ0) = (dR / R0) (12)
where ρ0 and R0 are the measured initial resistivity and resistance, respectively.
Parameter K (effective K), determined experimentally from this study for the smart spacer fluids by directly measuring the resistivity (ρ) and resistance (R), varied between 50 m-1 to 60 m-1, depending on the composition of the spacer fluids.

Electrical resistivity of the smart spacer fluids was measured using the conductivity probe and digital resistivity meter. To assure repeatability of the measurements, the initial resistivity was measured at least three times for each smart spacer fluid and the average resistivity is reported.
A commercially available conductivity probe was used to measure conductivity (inverse of resistivity), at a range of 0.1 μS/cm to 100 mS/cm, representing a resistivity of 0.1Ω.m to 10,000 Ω.m.
Digital resistivity meter (used in the oil industry) was used to measure the resistivity of the smart spacer fluid directly, at a range of 0.01 Ω-m to 400 Ω-m.
In the study, high-frequency alternative current (AC) measurement was adopted to overcome the interfacial problems and minimize the contact resistances.
Electrical resistance (R) was measured using an LCR meter, which measures the inductance (L), capacitance (C) and resistance (R)), during all the cleaning tests. This device has at least a count of 1 μΩ for electrical resistance and measures the impendence (resistance, capacitance and inductance) in the frequency range of 20 Hz to 300 kHz.
Based on the impedance (z)-frequency (f) response, it was determined that the smart spacer fluid was a resistive material. Hence the resistance was measured at 300 kHz using the two-probe method during the entire testing time.
Density. The density of the spacer fluid was 8.46 ppg. With the addition of 0.5% and 1% nanoFe2O3 (based on total weight of the spacer fluid), density increased to 8.51 and 8.55 ppg, respectively. Adding 0.5% nanoFe2O3 increased the density by 0.6%; adding 1% nanoFe2O3 increased it by 1%.
The water-based drilling fluid was prepared by adding 8% bentonite by weight of water. The density and resistivity of the drilling fluid were 8.2 ppg and 7 Ω-m.
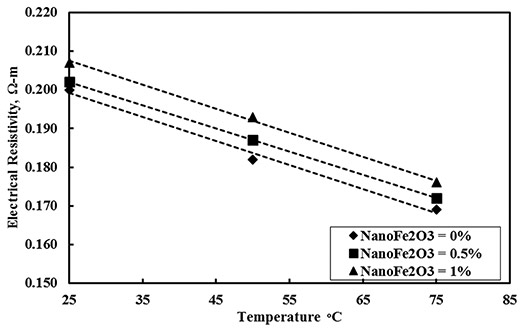
Temperature. The spacer fluids with and without nanoFe2O3 were subjected to a temperature of 25°C to 75°C to investigate the change in the fluid’s electrical resistivity.
Resistivity of the smart spaced fluid increased with the addition of more nanoFe2O3 (FIGURE 2). The resistivity of the spacer fluid with 0%, 0.5% and 1% nanoFe2O3 was 0.2 Ω-m, 0.202 Ω-m and 0.207 Ω-m. At 25°C temperature, the increase in the electrical resistivity was 3.5%, with addition of 1% nanoFe2O3.
Resistivity of the smart spacer fluid at 50°C increased linearly with addition of nanoFe2O3 content (FIGURE 2). With 0%, 0.5% and 1% nanoFe2O3, resistivity was 0.182 Ω-m, 0.187 Ω-m and 0.193 Ω-m, respectively. At 50°C temperature, electrical resistivity increased 6%, with addition of 1% nanoFe2O3.
The resistivity of the smart spacer fluid increased with the addition of nanoFe2O3 (FIGURE 2). With 0%, 0.5% and 1% nanoFe2O3 resistivity was 0.169 Ω-m, 0.172 Ω-m and 0.176 Ω-m, respectively. At 75°C temperature, electrical resistivity increased about 4%, with addition of 1% nanoFe2O3.
The electrical resistivity of the smart spacer fluid decreased from 0.2 Ω-m to 0.169 Ω-m, a 15% decrease, with the increase in temperature from 25°C to 75°C.
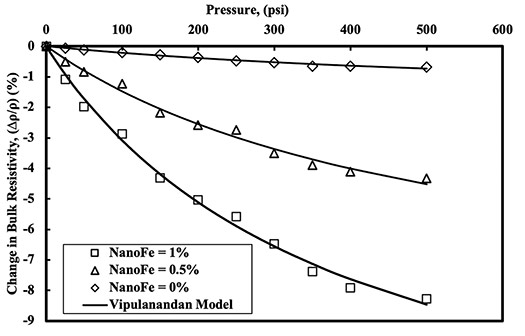
Piezoresistivity. Smart spacer fluid with and without nanoFe2O3 was subjected to pressure up to 500 psi in the high-pressure high-temperature (HPHT) chamber to investigate the piezoresistive behavior. Equation (8) predicted the results very well.
The resistivity of the spacer fluid decreased nonlinearly with increase in the pressure (FIGURE 3). At 500 psi pressure, the decrease in the resistivity was 0.7%, indicating low piezoresistivity characteristics of the spacer fluid.
The resistivity of the smart spacer fluid with 0.5% nanoFe2O3 decreased nonlinearly with increase in the pressure (FIGURE 3). At 500 psi pressure, the decrease in resistivity was 4%, indicating the piezoresistivity characteristics of the smart spacer fluid.
The resistivity of the smart cement slurry with 1% nanoFe2O3 decreased nonlinearly with increase in the pressure (FIGURE 3). At 500 psi pressure, the decrease in resistivity was 8%, indicating the piezoresistivity characteristics of the smart spacer fluid.
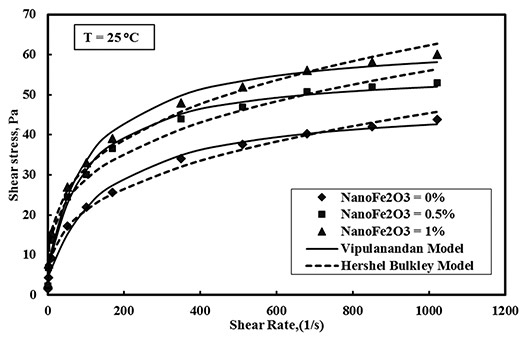
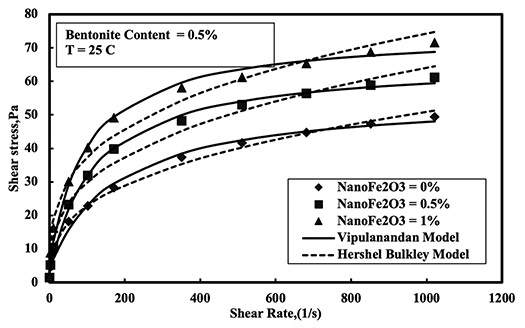
Rheology. Shear stress-shear strain rate relationships were predicted using the Vipulanandan rheological model and compared with the Herschel Bulkley models, as shown in FIGURE 4.
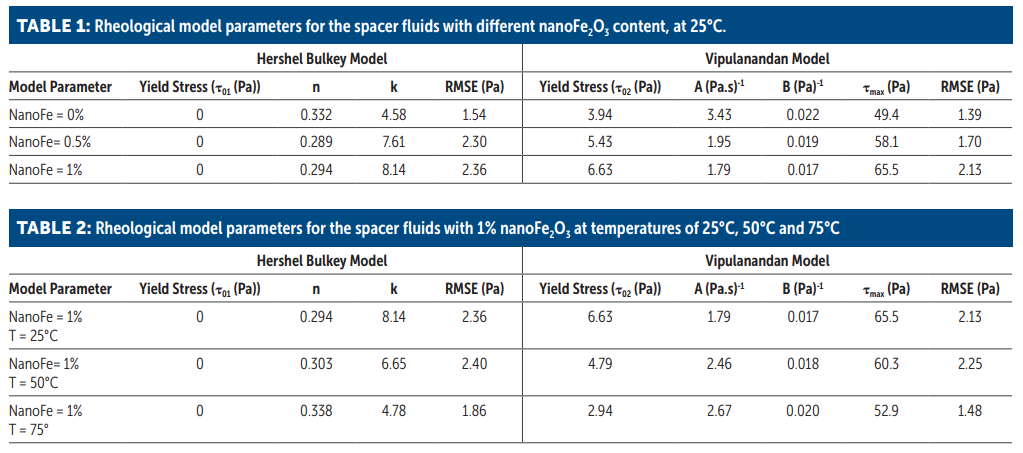
The root mean square of error (RMSE) for the Herschel Bulkley model varied from 1.54 to 2.36 Pa. Model parameter k for the spacer fluid at 25°C varied from 4.58 to 8.14 Pa.sn, as summarized. Model parameter n was in the range of 0.29 to 0.33 (TABLE 1).
The shear thinning behavior of the spacer fluid with and without nanoFe2O3 was modeled using the Vipulanandan rheological model, up to a shear strain rate of 1024 s-1 (600 rpm).
Increasing the nanoFe2O3 content in the spacer fluid increased its yield stress – from 3.94 Pa to 6.63 Pa when nano Fe2O3 was increased from 0% to 1%, at 25°C, as shown in FIGURE 3.
The τmax for the spacer fluid increased from 49.4 Pa to 65.5 Pa, a 33% increase, at 25°C temperature, with 1% addition of nanoFe2O3, as summarized. The root mean square of error ranged from 1.39 to 2.13 Pa (TABLE 1).
Effect of Temperature. Shear stress-shear strain rate relationships were predicted using the Vipulanandan rheological model and compared with the Herschel Bulkley models, as shown in FIGURE 5.

The shear thinning behavior of spacer fluids with 1% nanoFe2O3 at temperatures of 25 to 75°C was tested and modeled using the Herschel Berkley model up to a shear strain rate of 1024 s-1 (600 rpm). The root mean square of error (RMSE) for the Herschel Bulkley model varied between 1.86 to 2.4 Pa. The model parameter k for the spacer fluid at 25oC varied from 4.78 to 8.15 Pa.sn as summarized in TABLE 2. The model parameter n was in the range of 0.29 to 0.34.
The shear thinning behavior of spacer fluids with 1% nanoFe2O3 at temperatures of 25 to 75°C was tested and modeled using the Vipulanandan model up to a shear strain rate of 1024 s-1 (600 rpm).
The average yield stress for the spacer fluid at temperature of 25°C was 5.43 Pa, decreasing 45% with the increase in the temperature, to 2.98 Pa at 75oC. The τmax for the spacer fluid decreased from 58.1 Pa to 53 Pa (8.7%), with temperature increase from 25 to 75°C. The root mean square of error was in the range of 1.48 to 2.25 Pa, as summarized in TABLE 2.
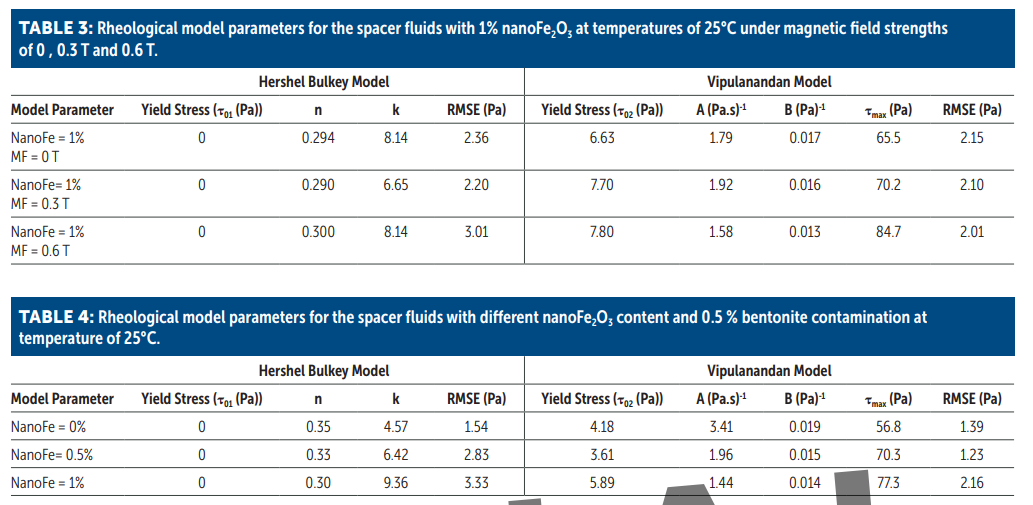
Effect of Magnetic Field. Shear stress-shear strain rate relationships were predicted using the Vipulanandan rheological model and compared with the Herschel Bulkley models, as shown in FIGURE 6.
The root mean square of error (RMSE) for the Herschel Bulkley model varied between 2.2 to 3.01 Pa. The model parameter k for the spacer fluid at 25°C varied from 8.15 to 9.97 Pa.sn as summarized in TABLE 3. The model parameter n was in range of 0.29 to 0.3 and the model predictions are compared in FIGURE 5.
Increasing the magnetic field strength from 0 T to 0.6 T, increased the yield stress from 6.64 to 7.8 Pa and τmax from 63.8 to 84.7 Pa, at room temperature. The maximum shear stress increased by 32.7% with magnetic field increase, from 0 to 0.6 T, as in FIGURE 5. The root mean square of error was in the range of 2 to 2.13 Pa, as summarized in TABLE 3.
Effect of Bentonite Contamination. The spacer fluid with 0.5% bentonite contamination showed increased rheological properties with the increase in nanoFe2O3 content at 25°C temperature, as shown in FIGURE 7.
The root mean square of error (RMSE) for the Herschel Bulkley model varied between 1.54 to 3.33 Pa. The model parameter k for the spacer fluid at 25°C varied from 4.57 to 9.36 Pa.sn, as summarized in TABLE 4. The model parameter n was in range of 0.3 to 0.35.
The shear thinning behavior of spacer fluids with different nanoFe2O3 content and contaminated with 0.5% bentonite was tested and modeled using the Vipulanandan model (2014), up to a shear strain rate of 1024 s-1 (600 rpm). Average yield stress for the spacer fluid without nanoFe2O3 was 4.18 Pa, which increased with the addition of nanoFe2O3, by 41 %. The τmax for the spacer fluid increased 36%, from 56.8 Pa to 77.3 Pa, with the addition of nanoFe2O3 at 25°C temperature. The root mean square of error was in range of 1.23 to 2.16 Pa (TABLE 4).
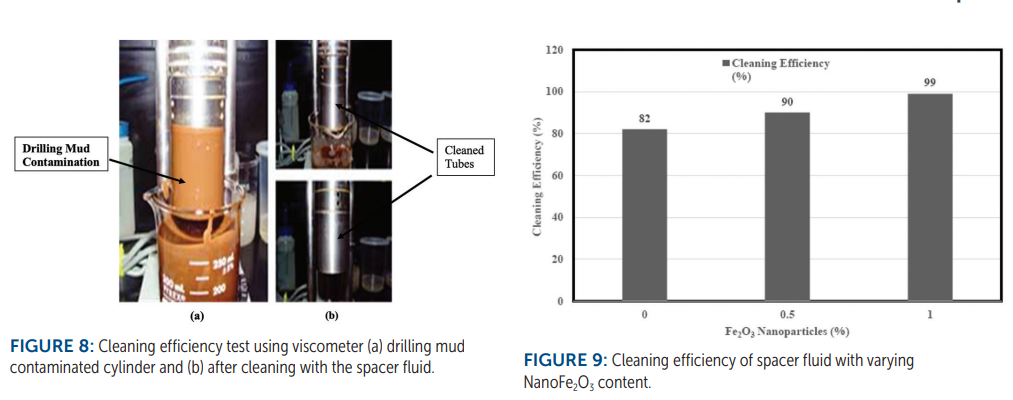
Cleaning Efficiency. The cleaning efficiency test to evaluate the smart spacer fluids in cleaning the bentonite drilling mud contaminated metal cylindrical tube (from the viscometer) was performed as shown in FIGURE 8. The weight of the metal tube was measured before contamination, after contamination and after cleaning. The cleaning efficiency of the spacer fluid was 82.3% without adding nanoFe2O3. With the addition of nanoFe2O3 cleaning efficiency increased 20.7%, from 82% to 99%, as shown in FIGURE 9.
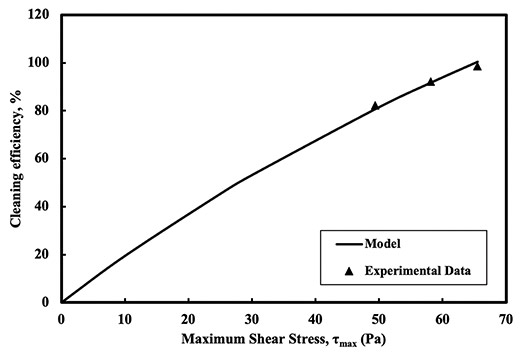
Maximum shear stress (τmax) of the smart spacer fluid indicated better cleaning ability of spacer fluid with 1% nanoFe2O3, as shown in FIGURE 10. The τmax increased 32.5%, from 49.4 to 65.5 Pa; with the addition of 1% nanoFe2O3, cleaning efficiency increased from 82 to 99%.
The relation between maximum shear stress and cleaning efficiency for the smart spacer fluids was modelled using Vipulanandan Cleaning Efficiency model in Eqn. (7). The model parameters E and F were 0.49 Pa% and 0.0025%, respectively, for the cleaning efficiency model. The R2 and RMSE for the model were 0.99 and 1.53%.
Increased efficiency was primarily due to better rheological properties, which produced higher shear stresses for cleaning and high surface-to-volume ratio of the nanoparticles. The maximum shear stress required to generate 100% cleaning efficiency was about 67 Pa.
Conclusions
In this study, smart spacer fluid samples were tested for material characterization, rheological, cleaning efficiency and piezoresistivity behavior. Also, the effects of the magnetic field strengths, temperatures and bentonite contamination on the electrical resistivity and rheological properties of nanoFe2O3 modified spacer fluid were investigated.
From the experimental study and analytical modeling, the following conclusions are advanced:
- Based on the material characterization, resistivity proved to be the sensing electrical property of the smart space fluid.
- Electrical resistivity of the spacer fluid decreased with increasing temperature, and it was an accurate sensing parameter for real-time monitoring to predict the rheological properties in the field.
- The addition of up to 1% nanoFe2O3 modified the yield stress, shear thinning behavior, and ultimate shear stress limit of the spacer fluid. Also, the Vipulanandan Rheological Model closely predicted the experimental results, based on the root mean square error (RMSE). Changes in the properties were influenced by the temperature, nanoFe2O3 content, and magnetic field strength, and were quantified using the Vipulanandan Correlation Model.
- The smart spacer fluid with nanoFe2O3 showed better rheological properties than spacer fluid without nanoFe2O3. The ultimate shear stress, a new rheological property quantified by the Vipulanandan Rheological Model of the spacer fluid, correlated well with the cleaning efficiency.
Example Study: Field Compaction Verification Using New Surface Penetrometer (SP-CIGMAT) During Construction
For site investigation, insitu tests are increasingly used to determine the soil properties for geotechnical analysis and design. Penetrometers evolved from the need to acquire data on subsurface soils that were not sampled easily by any other means. Hence, static and dynamic penetration resistances have been used to classify and characterize subsoils.
Compaction characteristics of soils (three-phase materials), depend on several factors, including soil type, moisture content and compaction energy. Since the 1930s, numerous laboratory and field investigations have attempted to understand the principles of compaction. Many researchers have tried to develop correlations to predict the laboratory compaction parameters by simulating the standard Proctor compaction test, using a smaller compaction apparatus, or by performing mathematical modeling.
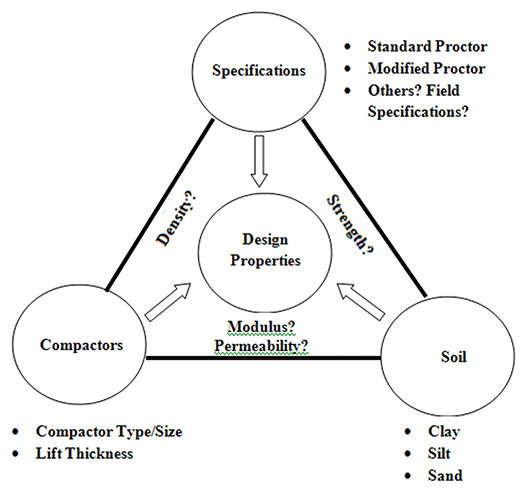
Correlations are important in estimating the engineering properties of compacted soils, based on properties shown in FIGURE 11. Index tests can be easily performed and are required for cohesive soils in all exploration programs. It is, therefore, useful to estimate the engineering properties of soils by using other, easily obtained, soil parameters.
Based on past studies, with an increase in the compactive effort, the maximum dry unit weight increases and is accompanied by a decrease in the optimum water content. These changes tend to be less pronounced with each additional increment in energy and finally level-off, where further increase in dry unit weight becomes negligible with higher compactive effort.
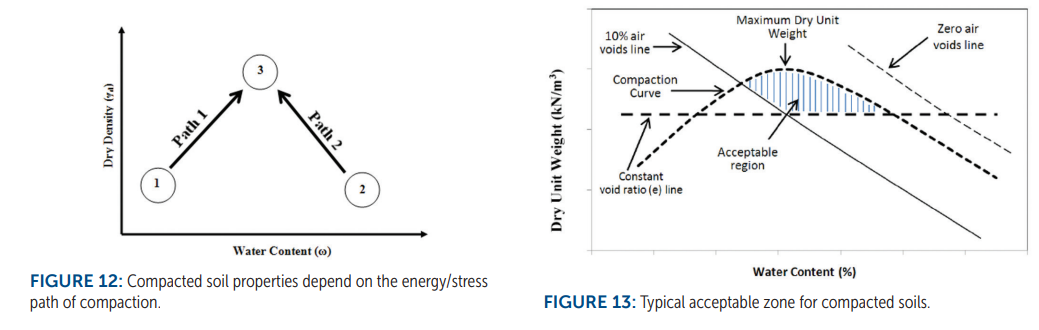
As shown in FIGURE 12, a soil at Point #1 or Point #2 could be compacted using different methods to reach Point #3, where the dry density and moisture content are the same. For example, Point #3 could be on the wet side of optimum on the compaction curve for Path 1 and on the dry side for Path 2.
Hence, for Point #3, the mechanical properties will be based on the energy/stress path the soil was subjected to during compaction. Although the same dry density and moisture content were achieved, the soil structure in the compacted soil will be different, based on the energy used for compaction.
Field Compaction Quality
Engineered soils are compacted to be used as fill materials for embankments, pavement subgrades, earth dam construction, and retaining wall backfills. When the fill materials are used in the field, there should be a method to achieve the required quality, as shown in FIGURE 13 (acceptable region). Because of that, the laboratory-determined properties are used in quality-checking and -assurance work.
In theory, a field inspector can rapidly determine if a soil layer meets the specified compaction criteria (dry density and/or moisture content) without obtaining a soil sample for laboratory Proctor compaction testing.
Quality control procedures usually include the field measurement of dry unit weight (γd/Field) and comparison of the laboratory maximum density (γd/Lab) values that are expected to be attainable in the field for the material and the applied compactive effort, based on laboratory compaction tests.
The ratio (γd/Field)/(γd/Lab) = RC (usually expressed as a percentage) is the relative compaction. It is often used as the criterion for compaction, where (γd/Lab) is the maximum dry unit weight of the soil for a given laboratory compaction standard. Also, several other methods have been used to control the field compaction, one of which is the air voids method (less than 10%) of evaluating the field compaction.
As is well-known, one of the most important parameters in a pavement management system (PMS) is both the functional and structural capacity of the pavement network. Currently, there is no standard field test to determine the strength of base and subgrade soils for construction quality control/assurance purposes, although many transportation agencies only use density and moisture measurement.
The falling weight deflectometer (FWD), geogauge, dirt seismic pavement analyzer (DSPA), and laboratory repetitive triaxial tests have been used to determine the pavement layer modulus. However, each method has limitations. As many different sets of layer moduli would satisfy the same FWD deflection bowl, practicing pavement engineers struggle to identify the correct set. Also, the FWD often is unable to determine the extent of a weak base/subgrade layer, due to a thick concrete layer that carries most of the load away.
Laboratory repetitive triaxial tests are seldom used to determine the layer moduli for routine design or QC/QA tests in current DOT environments. Seismic tests are quick and easy, but the seismically determined modulus is very high due to the high frequencies and miniscule loads used.
The geogauge is highly sensitive to the surface preparation, and it only gives a composite stiffness that includes all layers to some uncertain depth.
Compacted soils are those where the insitu structure is modified by compaction. The main objective of compaction is to improve the performance of a material by increasing its strength, stiffness and durability. There are many situations where compacted soils are used, such as constructing a new embankment, road, earth dam, building foundation and retaining wall back fills soils.
To inspect and verify the quality and construction of compacted soils, nondestructive testing devices are extremely attractive, due to the rapidity in performing the tests. Researchers have used dynamic cone penetrometer (DCP), California bearing ratio (CBR) and falling weight deflectometer (FWD) for evaluating earth structures, backfills for pipelines, pavements and subgrade soils.
The advantages of insitu testing include the disturbance is often less than in sampling and testing, and results can be viewed in real time and used to modify field compaction procedure.
Objective, Methods
The objective of this study was to compare the differences in field and laboratory compacted CL soil and evaluate the performance of a surface penetrometer (SP-CIGMAT) to characterize the compacted soil during construction.
A field test program was conducted to determine the compaction of soil using the Caterpillar 815F (45,765-pound, 3.88-foot drum diameter and 3.25-foot drum width). About 200 cubic yards of each CL soil was stockpiled on the site for testing.
The 16-foot-by-250-foot test pads were prepared by removing the top 18 inches of native soil, placing a geotextile layer at the bottom and refilling it with borrowed soils that were well-compacted to have leveled test pads.
Compaction of the several CL soils was studied for 8-inch lifts and unit weight, and moisture contents were measured at a minimum of five locations along the test pad after each pass of the 815F compactor. Compaction continued until the measured unit weight approached an asymptotic level. For each CL soil, compaction tests were performed for at least six moisture contents.
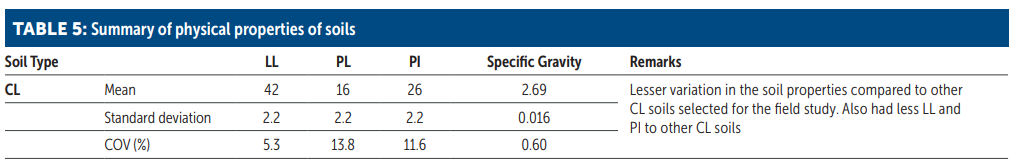
At least 10 samples were randomly collected from each CL soil stockpile to measure the physical properties. The results are summarized in TABLE 5 for one CL soil selected for this document.
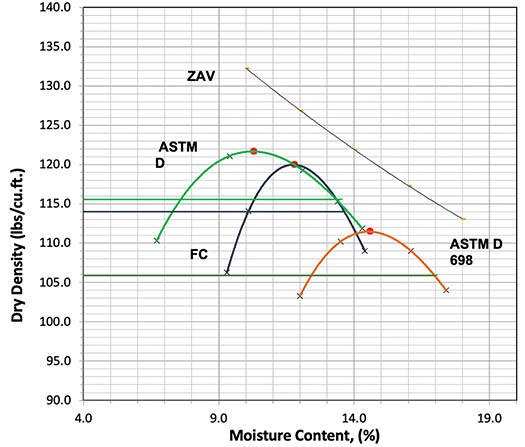
Test results from the laboratory and field compaction (FC)) studies for the selected CL soil are shown in FIGURE 14.
The relationship of standard Proctor (SP) test was not even close to the field compacted results and there was no overlapping of results at all (FIGURE 14). The modified Proctor (MP) test had a region of overlap with the FC on the wet side of the compaction curve (FIGURE 14), but results were mismatched for the rest of the curve/relationship.
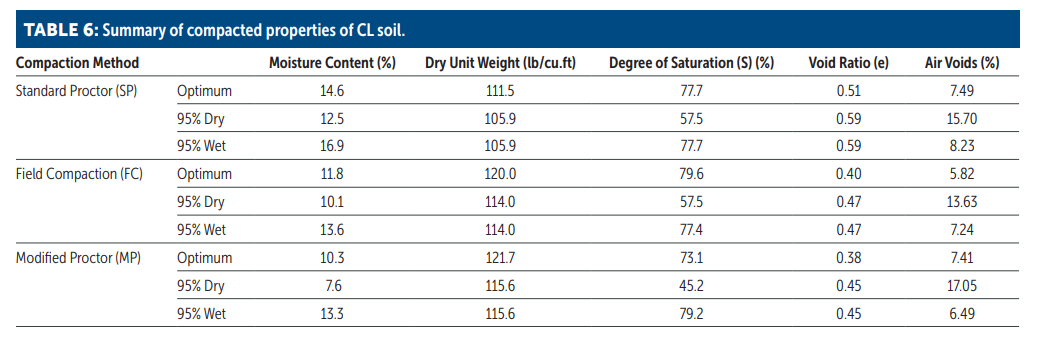
Optimum Conditions. As summarized in TABLE 6 and shown in FIGURE 14, the maximum dry unit weight (γd)max of the field compacted soil was 9.5 pcf, or 8.5% higher than the standard compaction. The relative compaction (RC) was 1.08. The FC–γdmax was 1.7 pcf or -1.4% lower than the modified compaction γdmax.
As summarized in TABLE 6 and shown in FIGURE 14, the optimum moisture content wopt of the field compacted soil was 11.8%, which was -2.6% lower than the standard compaction. In reality, this will prevent using excess water in the field for compaction. The FC–wopt was 1.5% higher than the modified compaction wopt.
As summarized in TABLE 6, the degree of saturation (S) for FC was the maximum, with 79.6% and the modified compaction had the lowest with 73.1%.
As summarized in TABLE 6, the void ratio (e) of the SP was the highest, with 0.51. The void ratio for FC and MP were 0.40 and 0.38, respectively. Hence, the FC–e was 21.5% lower than the SP-e. The void ratio showed the second-largest percentage difference in the properties investigated between the FC and SP compacted soils.
As summarized in TABLE 6, the air void ratio (Na) of the FC was the lowest, with 5.82. The Na for SP and MP were 7.49 and 7.41, respectively. Hence, the FC– Na was 28.7% lower than the SP-Na. The air void ratio showed the highest percentage difference in the properties investigated between the FC and SP compacted soils.
95% of Optimum Dry Condition. As summarized in TABLE 6 and shown in FIGURE 14, the 95% of optimum dry unit weight (γd):of the FC compacted soil was 8.1 pcf, or 7.6% higher than the SP. The relative compaction (RC) was 1.08. The SSCC–γd was 1.6 pcf or -1.4% lower than the MP-γd.
As summarized in TABLE 6 and shown in FIGURE 14, the moisture content (w) for the 95% FC compacted soil was 10.1%, which was -2.4% lower than the SP. The FC– w was 2.5% higher than the MP-w.
As summarized in TABLE 6, the degree of saturation (S) for FC and SP was the same, with 57.5% and the modified compaction had the lowest, with 45.2%.
As summarized in TABLE 6, the void ratio (e) of the SP was the highest, with 0.59. The void ratio for FC and MP were 0.47 and 0.45, respectively. Hence, the FC–e was 20% lower than the SP-e. The void ratio showed the highest percentage difference in the properties investigated between the FC and SP compacted soils.
As summarized in TABLE 6, the air void ratio (Na) of the FC was the lowest, with 13.63. The Na for SP and MP was 15.70 and 17.03, respectively. Hence, the FC– Na was 15% lower than the SP-Na. The air void ratio showed the second-highest percentage difference in the properties investigated between the FC and SP compacted soils.
95% of Optimum-Wet Condition. As summarized in TABLE 6 and shown in FIGURE 14, the 95% of optimum wet unit weight of the SSCC compacted soil was 8.1 pcf, or 7.6% higher than the SP. The relative compaction (RC) was 1.08. The FC–γd was 1.6 pcf or -1.4% lower than the MP-γd.
As summarized in TABLE 6 and shown in FIGURE 14, moisture content (w) for the 95% FC compacted soil was 13.6% which was -3.3% lower than the SP. The FC–w was 0.3% higher than the MP-w.
As summarized in TABLE 6, degree of saturation (S) for FC and SP were very close and was about 77.5% and the modified compaction had the highest of 79.2%.
As summarized in TABLE 6, void ratio (e) of the SP was the highest with 0.59. The void ratio for FC and MP were 0.47 and 0.45 respectively. Hence, the FC–e was 20% lower than the SP-e. The void ratio showed the highest percentage difference in the properties investigated between the FC and SP compacted soils.
As summarized in TABLE 6, air void ratio (Na) of the FC was the lowest with 7.24. The Na for SP and MP were 8.23 and 6.49 respectively. Hence the FC–Na was 12% lower than the SP-Na. The air void ratio showed the second highest percentage difference in the properties investigated between the FC and SP compacted soils.

New Surface Penetrometer (SP-CIGMAT)
In this study, CIGMAT Down-Hole Penetrometer (DHP-CIGMAT) was modified to CIGMAT Surface Penetrometer (SP-CIGMAT) and used for measuring the strength and modulus of compacted soils, as shown in FIGURE 15. Tests were performed on compacted soils varying from soft to very stiff clay, silty soils and sandy soils (CL, CH and SC).
A total of 19 field tests were performed with a Shelby Tube sampling the soil for the unconfined compression test.
SP-CIGMAT field tests were performed to investigate the relationship between penetrometer deflection (δmax) and compressive strength (σu), modulus (E) and CBR value of compacted soil layers, which were 8- and 12-inch depths. In these field tests CH, CL and SC were the major soils.
SP-CIGMAT was mounted to the sampling rigs, using 3-inch Shelby Tubes (Area ratio < 10%) (FIGURE 5). The location of tests was close enough to have similar properties with the samples, but far enough away not to be affected by opened hole.
The bearing capacity theory with non-linear relationship between soft rock/stiff clay unconfined compressive strength (σu, psi) and ultimate strength (qult, psi) was used:
qult = αq (σu)m , (13)
where, magnitudes of parameters m and αq depend on the type of soft rock/stiff clay and unconfined compressive strength (σu, psi = 2Su)). This relationship can be used to relate the undrained shear strength of soil (Su) to the penetrometer deflection (δmax).
The relationship for penetrometer deflections (δmax) and the shear strength (Su) is as follows:
Su = 56.4 × δmax1.78
N = 19, R2 = 0.72. (14)
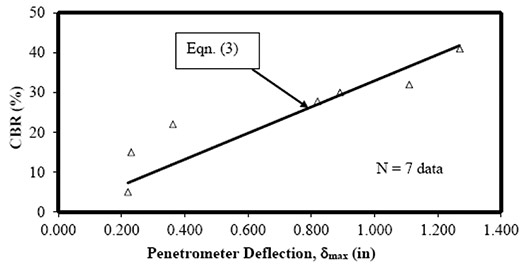
Present design approaches of subgrades for pavement design use California Bearing Capacity Ratio (CBR) values to determine the resilient modulus. Hence, it was of interest to determine the correlation between CBR and SP-CIGMAT penetrometer deflection.
Compacted field samples were collected in CBR molds and seven tests were performed in the laboratory. The relationship for penetrometer deflections (δmax) and CBR was as follows:
CBR = 33 δmax,
N = 7, R2 of 0.78. (15)
Conclusions
Based on the comprehensive field and laboratory compaction studies, the following conclusions are advanced:
- Field compacted (FC) dry density-moisture content relationship was different from the laboratory compaction test results. Hence, the laboratory relationships cannot represent the field compacted relationship.
- Void ratio (e) showed the highest or second-highest percentage difference in the FC and SP compacted soils.
- Air void ratio (Na) showed the highest or second-highest percentage difference in the FC and SP compacted soils.
- SP-CIGMAT deflection correlated well with the undrained shear strength of field compacted soils. The relationship was nonlinear.
CIGMAT 2023: March 3, Hilton Hotel at University of Houston
CIGMAT organizes an annual Conference and Exhibition, held on the first Friday in March, titled “Infrastructures, Energy, Geotechnical, Flooding and Sustainability Issues Related to Houston and Other Major Cities.” Speakers are invited from major cities, transportation authorities and energy industries around the country to present and discuss projects and problems related to construction, maintenance and rehabilitation issues.
The well-attended conference also covers technical issues related to maintenance and rehabilitation of water and wastewater systems, non-destructive testing methods, oil wells and pipelines, hydraulic fracturing and development of smart materials for various applications. A number of geotechnical topics related to expansive clays, rapid construction of deep foundations and ground faulting are also discussed.
Proceedings of the past 22 years of conferences are posted on the CIGMAT website: cigmat.cive.uh.edu
ABOUT THE AUTHOR: Dr. C. Vipulanandan (Vipu) is the director of the Center for Innovative Grouting Materials and Technology (CIGMAT) and professor of civil engineering at the University of Houston. He is also the inventor of Smart Cement.

Comments