February 2016, Vol. 71 No. 2
Features
Underground Construction 19th Annual Municipal Survey

Show Me The Money:
Post Great-Recession, City Budgets Are Increasing But Not Nearly Enough according to our 19th Annual Municipal Survey.
In 2015, more than half of the municipalities across the United States got a rare taste of what has become an exotic, opiate-like substance – and they liked it. So much so in fact, that they are clamoring for more in 2016.
That ‘opiate’ was simply increased funding levels. As the U.S. economy stabilized and actually grew – albeit at a slow pace – many city governments gained enough confidence to open the coffers and finally increase infrastructure funding in 2015 for something other than roads, bridges and airports, or emergency and stop-gap repair measures for sewer/water/storm water. The result was infrastructure spending at levels beyond initial expectations that continued throughout 2015 and should continue in 2016.
Municipal employees, having been fed a steady diet of budget cuts or holding the line since 2009, embraced the opportunity to take on long-delayed new construction and major rehabilitation work. Now, they want – and expect – more.
Funding soared to the top of the concerns impacting municipalities in 2016. For those cities whom saw budget increases last year, they very much appreciated having the increase funds but after a year of more aggressive construction and rehab, it made them realize just how much further their systems had eroded since 2009. “We were behind the eight-ball with our systems before the recession when our budgets were frozen,” observed this public works director from the Midwest. “When we started to engineer some work earlier in the year [2015], we didn’t know where to begin. It made us realize just how much further behind we were.”
These results and comments were generated from the 19th Annual Municipal Sewer and Water Survey. The exclusive survey presents a detailed look at the current spending plans for America’s cities along with insights and perspectives on industry topics and technology.
Spending levels
Reflecting the renewed availability of funds at local levels, municipal authorities report spending plans in 2016 for sewer/water/storm sewer piping systems of $10.7 billion in new construction and $8.2 billion for rehabilitation, an increase of 4.2 percent over actual 2015 spending.
Conducted in October and November of 2015, the survey polled U.S. municipalities about their 2016 infrastructure funding plans along with perspectives on technologies, trends, industry issues and working relationships with consulting engineers and contractors. The survey results came from all 50 states and were weighted for regional population density and city sizes to develop a nationwide benchmark that would allow for extrapolated projections.
Responding cities represented all parts of America, from coastal communities to mountain tourism locations to the plains of the Midwest and the forests of the Southeast. While large cities were included in the statistics such as Los Angeles, San Diego, Miami, San Antonio, St. Louis, Denver, Washington DC, New York and Honolulu, mid-sized communities responded strongly as well. Small cities from throughout the country have their fair share of underground infrastructure challenges. Among the small towns responding were Grandview, IN, population 860; Poy Sippi, WI, population 970; Burnside, KY, 1,250; Shinnston, WV, 1,500; and Olathe, CO, 1,800.
The survey showed that increased funding was cited by 77.4 percent of respondents as the number one need of their departments. In fact, municipal managers as a whole across the country would ideally like to see an annual increase in their budgets of 37 percent just to meet current needs. Said this respondent from the Northwest, “We’d love to have our budget increase by 100 percent – we really need to make a long-term investment in fixing, growing our infrastructure. But the problem is even if we have more money for project spending, we don’t have the staff to handle the workload and our city still has a hiring freeze
in place.”
More please
While the availability of more funds in 2015 and with the projection to continue that increase even more widespread in 2016 is encouraging, it does create a double-edge sword. Those cities who have received budget increases expect even more in 2016 though just how much additional funding will be available is still to be determined in many instances. That has led to other cities feeling the pressure to relax the purse strings and invest in underground infrastructure. For 2016, the majority of respondents (68 percent) do anticipate more project money. That compares to just over 50 percent who received additional funding in 2015. In fact, those cities who are still awaiting budget increases are not shy about expressing their frustrations.
Lamented this respondent from the Northeast, “we’re like many other communities – we’ve taken a ‘wait until it breaks’ attitude to keep ratepayers happy. Until recently, we have not had rate increases above 2 percent annually. We were able to do some PR work and get 8-12 percent annual increases over a five-year period, but now we are back to 2 percent annual increases.”
Overall, cities claim a need to increase overall spending by 37 percent just to meet 2016 needs. To fully address the years of neglect, shrunken budgets and ignored infrastructure piping systems, city personnel project that $232 billion needs to be invested just in sewers over the next two years. For water infrastructure, muni respondents estimate an immediate need for $178 billion and another $79.5 billion for storm water growth and repair.
In these times of multi-billion dollar consent decrees in large cities, it’s easy to overlooked smaller cities – under 250,000 population. Their infrastructure needs are no less important and cumulatively add up to big money – $55 billion is estimated that needs to be spent in just the next two years. The Great Recession has substantially widened the gap between infrastructure needs and actual funding levels.
Necessary rate hikes
Decrepit and failing sewer/water infrastructure – that can no longer be swept under the rug – has motivated an increasing number of cities to risk politically fallout and push for appropriate rate increases as well. More and more municipal governments are finding it necessary to address their deficient rate structure that fails to cover operation costs simply because it was easier for city governments to ignore rather than address. For sewer rates, the average time between increases was three years, down from 3.1 years in 2015. For water, that time span remained constant at 2.8 years.
Another major area of concern for municipal managers is a lack of qualified employees. Roughly 45 percent of the survey respondents said they were having trouble locating and hiring qualified employees and also have problems replacing their retiring workforce.
“Our biggest issue right now is managing the multitude of projects with the diminished work force while demands for service from our customers are continually increasing,” said this upper Midwest respondent.
“Replacing experienced decision makers with new people willing to learn the problems we encounter and how they can help is a major problem for us,” said this Texas public works official.
Other areas of concern cited by municipal personnel were various government rules and regulations. “Unfunded mandates and useless rules and regs” are the bane of this Southeast community according to one municipal manager. This California respondent concurred with the increasing regulatory environment. “Clean Water Standards are becoming more rigorous concerning storm drain systems.” A Southeast municipal respondent said that a major regulatory issue for them was “asbestos cement pipe bursting regulatory hurdles.”
The development and establishment of asset management systems that embrace the underground sewer/water/storm water piping system continues to gain steam. In 2016, 20 percent of U.S. cities report having some kind of asset management system in place; 55.2 percent have such a program in development; and only 13.9 percent state they have no plans to institute an asset management system at this time.
This mid-sized Northeast city was one of the majority with plans to “complete the establishment of our asset management program and mapping our water and sewer infrastructure with attributes”
in 2016.
Trenchless
The survey measured the impact of trenchless construction and rehabilitation methods. During the budget-crunching times, trenchless rehabilitation gained ground as a cost-effective and successful stop-gap measure to stretch dollars. That was great for the growth of trenchless rehab but the flipside is that as budgets were increased for many cities in 2015, new construction jumped and that often did not include trenchless operations.
About 53.2 percent of municipal personnel report that they would prefer to use trenchless methods for a wide variety of reasons – a slight increase over last year. However, 23.4 percent still do not prefer trenchless methods – also a slight increase – while 23.4 percent say it doesn’t matter whether trenchless construction is utilized or not.
Despite the preferences of cities, the real world practical application of trenchless methods still lags behind. Cities indicate that for rehabilitation projects, trenchless methods will be used approximately 40 percent of the time in lieu of dig and replace in 2016. For new construction, municipal respondents anticipate that trenchless will be used on about 18.5 percent of the jobs. Overall, cities report that contractors will most likely use at least some trenchless methods on roughly 33 percent of their projects.
Municipal respondents shared many kudos and justifications for implementing trenchless solutions. “Less disruptive, less restoration, less traffic control, less headaches” said this West Coast municipal official. Added this respondent from the Midwest, “In developed neighborhoods this is the only method we specify due to restoration.” Pointed out a respondent from the Northeast, “As a municipal utility with a lot of underground conflicts, trenchless has obvious advantages.” Perhaps the most self-evident answer came from a Southeast municipal official who observed that “Customers are much more forgiving when trenchless methods are used.”
Yet there are those that are not supporters of trenchless methods for practical reasons. A respondent from the Midwest emphasized that “our relay work requires water service lines be replaced and open-cut is necessary for those, and overall reconstruction is less expensive.” From the lower Midwest, this city representative stresses that “trenchless methods are not as economical in rural areas.” This person from the Mid-Atlantic region still expressed a distrust of trenchless work in their area: “We would rather expose what is being worked on to ensure proper repair.”
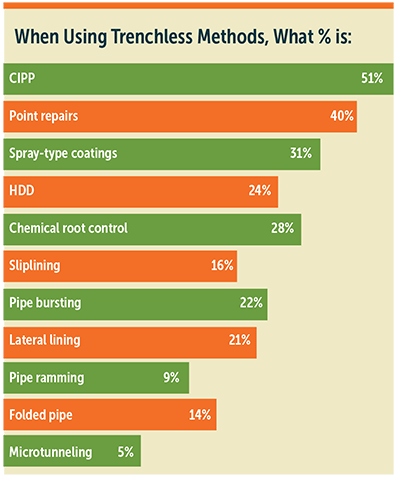
Cured-in-place-pipe is by far the most preferred trenchless method, cited by 49 percent of respondents, followed by point repairs at 40 percent, spray-on coatings at 31 percent, chemical root control at 28 percent, directional drilling at 24 percent, pipe bursting at 22 percent, lateral lining at 21 percent, sliplining at 16 percent, folded pipe at 14 percent, pipe ramming at 9 percent and microtunneling at 5 percent.
Maintaining, rehabilitating and replacing manholes are an ongoing challenge for virtually all municipalities, large and small. As such, 192,500 manholes are estimated to be replaced or rehabbed in 2016.
Rating engineers
One of the more interesting – and insightful – aspects of the Municipal Survey are the performance ratings. It asks city personnel to evaluate their relationships and effectiveness of both contractors and consulting engineers – two groups that must work in sync with municipalities to ensure quality, on-time and on-budget performance of various construction and rehabilitation projects. While the five-year rating trends are very telling, the subsequent comments are particularly revealing for those willing to review and seriously contemplate what their customers are saying about them.
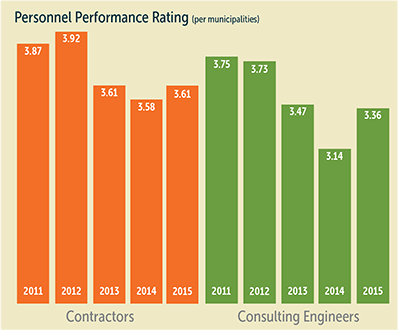
The ratings are based on a scale of 1 to 5, with 5 being the highest mark.
The good news for engineers is that after falling to a near-record low rating of 3.16 for work completed in 2014, muni officials felt somewhat better about consulting engineers’ job performance in 2015, raising their overall rating to 3.36. A definite improvement but a far cry from the peak engineer rating of 3.75 in 2011.
This respondent from the Mountain West wants consulting engineers to “act as an owner when dealing with contractors.” Another respondent from the Midwest stated that engineers need to have “a better understanding of the technology.”
A respondent from the Southeast had this strong suggestion for consulting engineers: “Take advice from the people working in the field that do this on a daily basis.” Another comment from a Mountain West community agreed, saying “many [engineers] are very young and lack field experience. More oversight by more qualified engineers would be helpful.”
Another respondent from the Midwest wants engineers to “quit trying to overbuild our projects or offer just the Cadillac version when the Chevy would work just fine.”
Complained this respondent from the Southeast, “We see several engineering companies that specify some type of trenchless rehab that they have heard about or read about, but have never actually been on site to see it installed.”
This Northeast municipal official has a problem that unfortunately is not unique to smaller cities. “We are a small rural community so we do not have good access to many qualified engineering firms. We do have a small, local firm that has been great as far as adapting new technologies and thinking outside of the box – especially when it comes to finding cost effective solutions. Unfortunately this firm is in high demand and it is getting more difficult to get projects done in a timely fashion.”
Rating contractors
Contractors saw their performance rating increase slightly to 3.61 compared to 3.58 a year ago. That is still substantially below their previous high of 3.92 in 2012.
Like with consulting engineers, there was no shortage of comments when asked how contractors could do a better job of working with municipalities.
“Be more cost effective up front and not get in the middle of a project, start submitting change order and ask for more money,” emphasized a Southeast official. Another respondent from the Southeast offered a similar comment: “Don’t low ball the bid; bid the project with correct numbers and reduction of change orders.”
This comment from a city official in the Mountain West was echoed by several other respondents: “be more knowledgeable about emerging technologies.”
Another subject that garnered several comments involved cooperation. “Contractors should educate their employees to work with informing residents, especially when working in their back yards,” pointed out this Texas municipal official. “Contractors can be more attentive to customer complaints,” added this Gulf Coast respondent.
A Southeast city respondent suggested that contractors should “come to the projects with a better idea of being a partner with the agency and not the enemy.” A Mid-Atlantic official agreed: “Work with the agencies instead of against them.”
A Midwest muni respondent wants contractors to “offer as many alternatives as necessary, but don’t try to force a method that may not be the best application.” Added a Gulf Coast city official, “Be realistic about time frames for performing work. Don’t make promises you can’t keep.”
This municipal official from the West Coast expressed his needs quite succinctly, yet several others made similar comments: “We need warranties on a contractor’s work.”


Comments