
February 2023 Vol. 78 No. 2
Features
26th Annual Municipal Sewer/Water Infrastructure Forecast & Market Analysis

Robert Carpenter | Editor-in-Chief
Funding Bonanza Continues in 2023
(UI) — To say 2022 was an eventful year for the underground infrastructure industry would be an incredible understatement. The billions in federal monies being pumped – finally – into the nation’s infrastructure was game-changing for many cities.
But what was even more phenomenal was specifically that underground infrastructure, finally, was recognized as vital to the nation. Thus, many billions were earmarked for a variety of applications across the sewer, water, storm water, fiber and electric industries.
In late 2021, Congress finally passed a meaningful and desperately needed Infrastructure Investment & Jobs Act (IIJA). For the sewer/water markets, $44 billion was designated over a five-year period beginning in 2022. And while it was, indeed, a great year for infrastructure advancements in many ways, we’re just getting started.
This data and much more was the focus of Underground Infrastructure magazine’s 26th Annual Municipal Sewer/Water Infrastructure Forecast & Market Analysis. The survey polled U.S. municipalities about their top concerns and issues, 2023 infrastructure spending plans and working relationships with consulting engineers and contractors.
This exclusive annual study also provides detailed insight into America’s cities, with information and perspectives on industry topics and technology. It reflects only information regarding sewer, water and stormwater piping infrastructure and does not include figures or data on pumping and lift stations, treatment plants, etc.
Respondents ranged in size from rural communities of less than 1,000 to mid-sized cities up to 500,000, and a representative sampling of the nation’s largest municipalities. Survey results came from all 50 states plus the District of Columbia and were weighted for regional population density and city sizes to develop a nationwide benchmark that would allow for statistical extrapolation.
While large cities were included in the survey, special care was taken to include mid-sized and smaller communities. Even tiny hamlets responded with their perspectives giving the survey accurately weighted results.
Structure
To review, IIJA provides funding through several new programs and also includes $11.7 billion over five years for both State Revolving Funds: $2.202 billion in Fiscal Year (FY) 23, $2.403 billion in FY24, $2.603 billion in FY25, and $2.590 in FY26.
The first two years, (FY22 and FY23) have a reduced state match of 10 percent but reverts to 20 percent for FY24–26. The other main concession is that states are required to spend at least 49 percent of these funds in the form of grants or 100-percent principal forgiveness – a much higher share than usual not needing to be repaid.
Also, IIJA contains $15 billion to replace all service lines covered by the EPA’s Revised Lead and Copper Rule – lead lines and galvanized pipe downstream from a lead pipe. Congress has been under extreme public pressure since the Flint, Mich., lead-poisoning disaster a few years ago, and investing in lead pipe replacement has been a high priority.
Much of the federal funding was dispensed directly to states via Environmental Protection Agency (EPA) grants. From there, state Departments of Environmental Quality (DEQ) and various local agencies guided the funds to projects and needs. Funding awards were spread throughout the year in various sizes, rather than in a singular concerted nationwide initiative.
It was as if the EPA/federal government wanted to ride the goodwill wave for all of 2022. Regardless, the money arrived and is being enthusiastically spent.
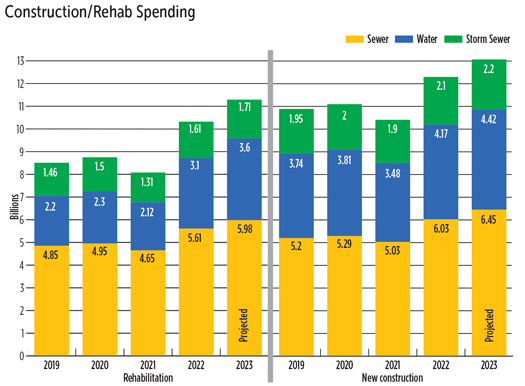
As we enter 2023, the funding gravy train news keeps getting better. In 2022, sewer and water spending jumped almost 15 percent on a national average. Yet, forecasting experts are projecting the spending love will not only match that in 2023, but should come in significantly higher – perhaps by as much as 10 percent.
Underground Infrastructure magazine works closely with FMI, the nation’s leading consulting and investment banking firm for construction companies within the built environment. Notably, FMI is forecasting that spending increases for municipal sewer and water could jump by as much as 12 percent in 2023 and 2024.
UI’s forecast, on the other hand, is a bit more restrained, though still very positive. UI’s data is based on projections from direct municipal responses. While largely mimicking 2022 and anticipating continued growth in 2023, cities tended to be somewhat more cautious in their responses.
Still, the outlook for 2023 is the best it has been for decades and 2024 could be even better. That is incredible news any way you process it.
Positive
“We’ve got a tremendous amount of work we’re engineering and releasing for some big projects that have been pending,” said a municipal respondent from the Northeast. “We have needed to get this work started for some time and now we feel confident we have the money to make some big leaps forward.”
A municipal manager from the West Coast agreed. “We would never have been able to finance this major project we’re in the middle of right now without federal assistance.”
Further, there seems to be an increasing momentum at the state and local level to ante up with additional funding to further supplement federal funds. The state governments have rarely had such large amounts to divvy up among needy cities in the past. Those officials apparently believe that supplementing landmark federal spending with even more state and local funds presents a rare opportunity to truly attack problems and needs that have been simmering on the backburner for decades.
An inadvertent bonus of the IIJA funding bonanza is that it has changed the average citizens’ perception of public works projects. Attacking sewer and storm-sewer issues are now viewed in a favorable public light, rather than being ignored for “important” political items, such as pocket parks in a local politician’s neighborhood.
Water construction and rehabilitation is on a roll, as well. Lead pipe replacement continues to be a major driving force, but water main and distribution improvements, expansion and rehabilitation are also peaking. Further, the acute drought conditions in the western U.S. continue to force states and cities to scramble for solutions, including enhanced transportation and storage systems, expanding water reuse efforts and improving water capture programs.
The recent round of severe storms in California and other western states brought some welcome drought relief, but unfortunately, failed to control, divert and store much of the rain. Far more was lost to a variety of factors, including runoff into the ocean.
The storms also brough heavy snows that accumulated in the mountains. When winter mountain snowpacks melt in the Spring, that flow typically drains into rivers and ultimately replenishes lakes and storage reservoirs. During the lingering drought of the last several years, snowpacks have been minimal and unable to resupply reservoirs adequately.
Recent storms did supply heavy snow in many mountain areas, but it takes several winter months to build adequate snowpack. If there isn’t enough additional snow through March, the Spring runoffs would, again, fail to resupply reservoirs.
Needless to say, plans continue for better water pipeline transmission to dry or drought-stricken areas – assuming additional water supplies can be found or developed.
Relieve
Many of the survey respondents felt a sense of relief when their cities were awarded grants for water or sewer projects.
“We’ve been falling further behind each year with our projects,” said a Midwest municipal employee. “Finally, we can make a little progress and we plan on continuing to apply for funds.”
Which brings up another question: how much funding will go to the same cities? Are all projects evaluated based upon need or will the government money and state DEQs try to spread funds around to touch multiple projects? Some comments from small city survey participants indicated they were feeling slighted in the first round of funding.
“Granted, our funding needs are a drop in the bucket compared to [large city]. But just because we’re a small town doesn’t mean our need is any less,” said this Mountain states municipal manager. “We definitely have major problems and because we are a small town means our funding options aren’t as great as our big city neighbors. We’re hoping we won’t be bypassed again this year.”
Several other small cities indicated similar concerns.
Still, overall, this major influx of funding has given municipalities a much greater confidence in spending for 2023, compared with recent years. Most survey respondents (75 percent) will be seeking a piece of the abundant federal funding pie. Plus, consulting engineering companies have increased their engagement in aiding cities of all sizes to find funding options, whether it be federal grants or matching funds, SRFs or state options.
During the pandemic, two major funding packages increased the U.S. financial deficit by trillions of dollars. With the infrastructure act and spending programs continuing to run up the national debt, inflation rates have been driven to 40-year highs. The federal dollars are not stretching as far as hoped and lessening the desired effect for infrastructure projects.
As of this writing, inflation has started to come down from its June high of 9.06 percent to 6.45 percent in December 2022. As our FMI friends explain “… inflation above 7.0 percent is significantly greater than the target of stable monetary policy and a 2.0-percent inflation rate.
“The consumer felt the impact of inflation over the last 18 months, but if inflation holds at current levels, two-year price increases would be back above 14 percent. These are price increases reminiscent of the late ‘70s, early ‘80s.”
More
Even with all the spending of 2002 and projected through 2026, most city personnel responding to the survey still admit it’s not nearly enough to satisfy their needs.
“We’re so far behind, it’s going to take decades for us to dig ourselves out of the hole we’re in,” said a municipal manager for a major city in the Northeast. “We’re making progress right now, but what happens when the federal dollars run out? Will our city management do what it takes then to keep our spending levels where they need to be?”
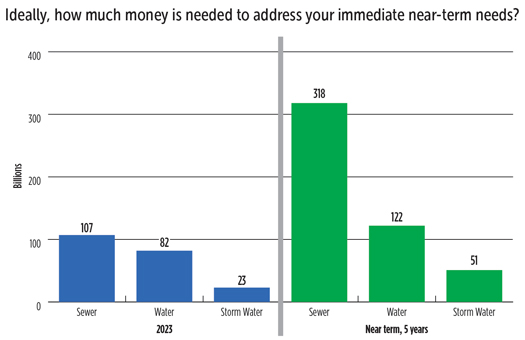
City personnel were asked to, assuming a perfect world, put a price tag on their near-term funding needs to address all their system issues. Respondents believe they would need $107 billion for sewer, $82 billion for water and $23 billion for stormwater. When asked the same question, but for a five- to 10-year period, the amounts increased to $318 billion for sewer, $122 billion for water needs and $51 for storm sewers. Clearly, expanding and refurbishing the U.S. underground infrastructure is a long-term proposition.
Respondents report that their city governments are still reluctant to raise user fees, especially with the cloud of a potential economic recession floating overhead. But clearly, survey respondents said, it is still an active option on the table.
“We increased rates in 2020, skipped ’21 and ’22 due to the pandemic, but we’ll probably have to boost sewer and water rates in 2023,” said a Southwest respondent. “We think we’ll receive some government money in 2023 but it won’t be nearly enough to catch up.”
That sentiment was repeated frequently by survey participants. “With the cost of everything going up, we’ve got to raise rates just to keep our heads above water,” lamented this respondent from the Midwest.
Survey respondents reported an average of 3.2 years between rate hikes, an increase from 2.8 years in 2021 and 3.0 in 2022.
Municipalities rated several broad categories in terms of level of impact on their operations. The order of emphasis mirrored 2022. Funding remained the number-one concern, with 76 percent of respondents citing that issue. Regulations/EPA was cited by 72 percent of the respondents; hiring qualified employees by 59 percent; safety concerns by 34 percent; and community relations by 32 percent.
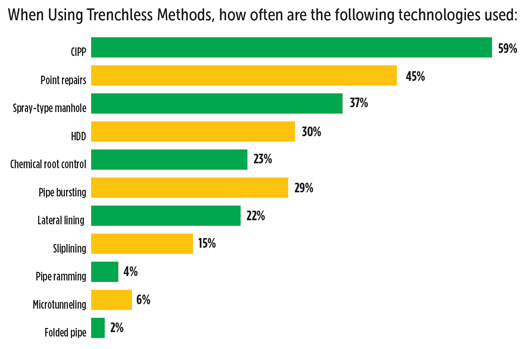
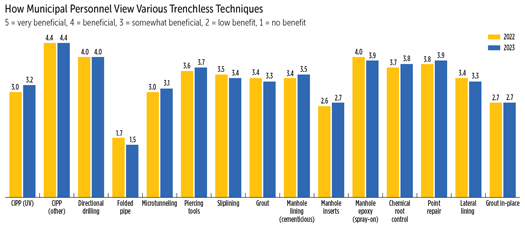
About 45 percent of those surveyed commented that they prefer to use trenchless methods when feasible, down slightly from 2021’s 47 percent, while 39 percent said it didn’t matter and 16 percent still prefer open-cut methods.
Rating engineers, contractors
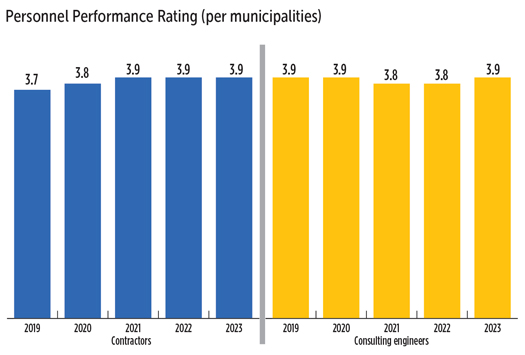
The survey also asked municipal personnel to rate the consulting engineering community, based on a 1-to-5 scale, with five being the highest approval. Basically, this number provides a confidence benchmark. The consulting engineer score for 2022 improved slightly to 3.9 percent.
For the most part, respondents were pleased with the efforts of consultants. “We’ve had pretty good relationships with our engineering consultants,” explained this city official from the Southeast. “We received a healthy matching fund grant [in 2022] and with the help of the consultants, we brought it on-line in record time.”
Said another respondent from the Northeast, “We’ve got decaying pipes everywhere we turn, so we’re always trying to stretch our rehab dollars whenever we can. Our consultants have been critical in helping us keep up with the work.”
A somewhat cynical response from a West Coast survey participant was that “when we got a large award amount from the infrastructure bill, consulting engineers were coming out of the woodwork, happy to help us out.”
As for how engineers could improve their relationship with and support for cities, several familiar themes were repeated. Quality, by a large margin, was again the most-cited factor, by 80 percent of municipal mangers. Other areas included “understanding of new technology,” cited by 75 percent of respondents; “cost” by 74 percent; and “productive relationships with contractors” was mentioned by 40 percent.
The survey also asked municipal personnel to rate contractors. The overall rating was a composite from four categories: quality of work, timely project completion, fair pricing and dependability, based on a scale of one (worst) to 5 (best) Contractors saw their composite score hold steady at 3.9.
Like engineers, quality was the number-one desired trait for contractors, cited by 82 percent.
Comments