
July 2022 Vol. 77 No. 7
Features
Utility & Communications Construction Update

Daniel Shumate | Managing Director, FMI Capital Advisors Inc.
“Less for More” remains the theme for 2022, as price increases in labor, materials and fuel plague the underground construction industry. The “transitory” discussions of 2021 are a distant memory and pricing pressure is affecting almost every line-item of the bid sheet. This has begun to impact both the public and private markets. The stock market has declined significantly, as has first-quarter deal activity, across all markets.
Additionally, due to rising demand and, most recently, the war in Ukraine, oil prices have increased at almost break-neck speed over the last two years – more than 500 percent since the lows of 2020. Due to the federal government’s environmental policies, however, U.S. energy companies are hesitant to make the investments in drilling and large pipeline infrastructure that would accommodate price decreases.
As a result, gasoline prices have increased to an average of $5 per gallon for the first time in U.S. history.
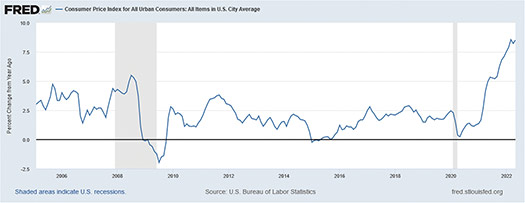
Finally, labor prices have risen year-over-year, attempting to keep pace with mounting inflation and because the market has been near full employment for some time (see FIGURE 1 for CPI). However, the Federal Reserve’s actions will weigh heavily on the economy, and increased availability and decreased labor costs should occur as the federal rate grows.
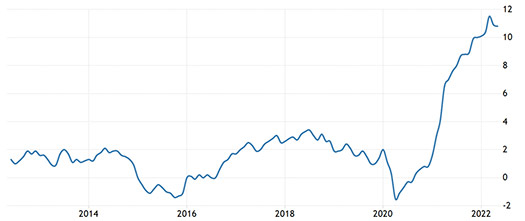
In addition to the often-cited CPI (Consumer Price Index), Producer Price Index (FIGURE 2) is a common reference for us, because there is less variability in its calculation. Actual producer prices (rather than proxies for the prices, or owners’ equivalent rent) make up the index. Thus, the rise of over 10 percent more accurately reflects current inflation and the impact to both businesses and consumers, alike.
Along with price, housing supply data is a leading indicator of recessions, and the most recent uptick suggests we are on the leading edge. A rise of over eight months in supply foretold the 2008 financial crisis, the decline in the early 1990s, and the inflation crises during the early ‘80s.
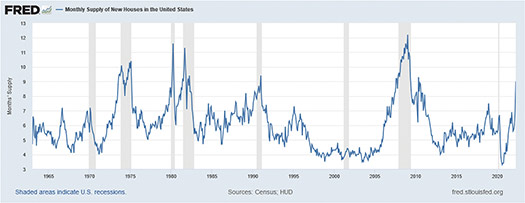
Housing prices were already at record highs across the United States. With the rates increase, there have been significant declines in consumers’ ability to pay for those houses and in the ability to build new, affordable homes.
The result is a major increase in supply that we don’t expect will abate until the Federal Reserve can lower rates once again. Therefore, underground and site construction tied to new-home development is likely to decrease, since generating a return on those investments will be much more difficult in a high-rate environment.
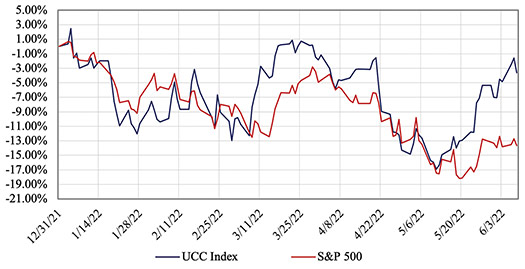
The Utility & Communications Construction Index (UCCI) presented below covers performance of the sector’s publicly traded stocks year-to-date (FIGURE 4) and over the past three months (FIGURE 5).
S&P 500’s decline was the steepest drop in that index to start any year since 1939 (the Great Depression). In the past month, S&P 500 has come off the lows of the year but will likely move into bear territory (down >20 percent) as the year progresses.
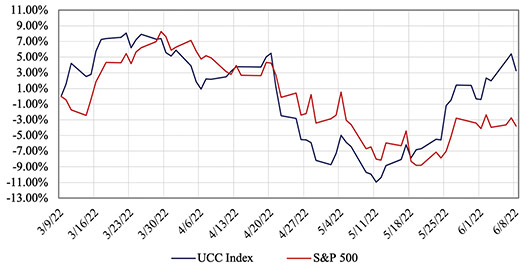
UCCI, in contrast, has performed relatively well, primarily due to the rising oil prices and expected rotation of funds into infrastructure investments that have previously been funded through the Infrastructure Investment and Jobs Act.
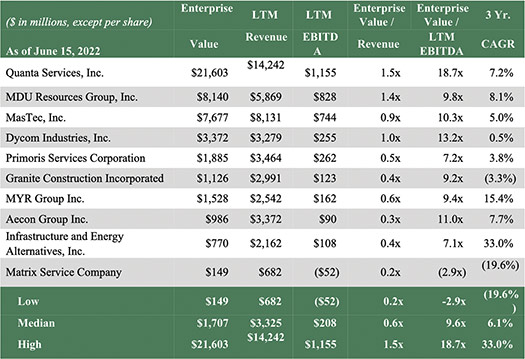
Companies comprising the UCCI have held valuations and maintained consistent performance, despite the headwinds that are facing other industries. We expect the service companies to experience pushback on price increases from both investor-owned utilities and municipalities, as their customer base struggles with rising utility bills. Thus, margin pressure from labor, limited price increases and fuel prices may impact performance in the remaining months.
The pace of underground infrastructure mergers and acquisitions moderated somewhat in the second quarter of 2022. Primary areas of interest for acquirers remains the communication and power markets, although Argonaut acquired Bandera Utility Contractors to enter the wet utility construction space.
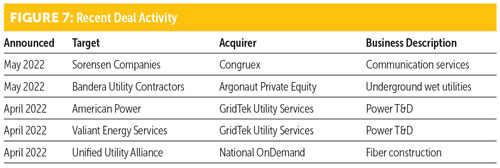
As interest rates rise and valuations for public companies decline, the gap between what a seller is looking for and what a buyer views as accretive begins to widen and creates a more challenging acquisition environment. We expect the second half of the year to be more muted, compared to the record activity in 2021. UC
Comments