January 2022 Vol. 77 No. 1
Features
CIGMAT Report
The University of Houston’s Center for Innovative Grouting Materials and Technology (CIGMAT) is an integrated, inter-disciplinary, university-industry consortium dedicated to research that fosters understanding of grout, and competing and complementary, materials and technologies used in constructing and rehabilitating civil infrastructure.
CIGMAT is directed by C. Vipulanandan (“Vipu”), Ph.D., P.E., Professor of Civil Engineering, University of Houston, Houston, Texas, who, since 1984, has been the principal or co-principal investigator for more than 80 projects, funded by federal, state and local agencies and industries, totaling more than $13 million.
Technology transfer
Even more significant than the research itself, is CIGMAT’s focus on transferring technology from control studies to actual applications.
Over the past two decades, more than 60 commercial products, including rapid repair materials, coatings, grouts, liners, cementitious and polymer composites and pipes, have been researched and tested, often via unique and innovative testing facilities and protocols. This includes widely adopted models and methods, and has received recognition from dozens of national, state and local awards, as well as several patents.
In the spirit of technology transfer, CIGMAT has shared the research and applications through more than 285 published papers and almost 200 presentations at national and international conferences.
At its own conference and exhibition, “Infrastructures, Energy, Geotechnical, Flooding and Sustainability Issues Related to Houston and Other Major Cities,” professionals and academia gather to hear invited speakers from major cities, transportation authorities and energy industries around the country. Held annually, the first Friday of March, at the University of Houston Hilton Hotel, the 2022 (27th event) CIGMAT conference will be March 2.
Vipu has also shares CIGMAT research and applications in his new book, Smart Cement: Development, Testing, Modeling and Real-Time Monitoring, published by Taylor and Francis Group – CRC Press. It covers projects in recent years that have led to developing highly sensing “smart” materials, integrated with real-time monitoring and wireless transferring, for infrastructure construction, maintenance, repairs and detecting leaks.
SMART CEMENT FOR GAS LEAK DETECTION
Several such systems are being developed to monitor the performance of the cement sheath that is embedded between the well casing and geological formations to protect pipelines against corrosion and impact loading, restrict the movement of fluids between formations, and isolate the productive and the nonproductive zones.
Oil well cement is used under different conditions of exposures, compared to the cement used in the conventional construction industry. The strength of oil well cement usually depends on factors such as time and conditions of curing, environmental conditions, slurry design and use of additives and any additional treatments.
Real-time monitoring of changes in the cement in-situ is also critical. Gas leakage occurs due to incorrect cement densities, poor mud, and filter cake removal leaving a route for gas migration, premature gelation leading to hydrostatic pressure control and high shrinkage of cement.
Various methods have been suggested to prevent or control the gas migration in oil cement. One is the use of polymer additives to modify the hydration and sensing behavior of cement.
In this study, CIGMAT investigated the effects of modifying “smart” cement with styrene butadiene polymer, which promotes the reaction of calcium aluminate with gypsum, while restraining the formation of calcium silicate hydrates (C-S-H) gel.
Different manufacturers recommend different percentages of polymer for controlling fluid loss and gas migration. Unfortunately, the conditions in-situ cannot be monitored with the currently available technologies.
Therefore, the CIGMAT study was specifically designed to:
- Investigate and quantify the changes in the initial and curing electrical resistivity during the curing time of the SBR polymer modified smart cement.
- Characterize the piezoresisitive behavior of smart cement without and with the polymer addition.
- Investigate the control and detection of gas leaks with the SBR polymer addition at two different curing times.
- Correlate the gas leak rates with changes in electrical resistivity for the smart cement without and with SBR polymer.
Materials, Methods
Class H smart well cement, with water-to-cement (w/c) ratio of 0.38 was used. To improve its sensing properties and piezoresistive behavior, the smart cement was modified with 0.1 percent conductive fillers (CF) by weight of cement.
Two other smart cement slurries were prepared with commercially available SBR polymer at 1 percent and 3 percent. Cement, water, and additives (0.1 percent CF and SBR polymer) were mixed at the speed of 4000 rpm for 3 minutes and 35 seconds at 1200 rpm.
To monitor cement-setting and compressive stress tests, 50-millimeter (2-inch) diameter, 100-millimeter (4-inch) height cylinders were prepared. For real-time monitoring, a two-probe method was selected.
Electrical resistivity was measured by using an inductance, capacitance, and resistance (LCR) digital meter during the cement curing and compression test. To minimize contact resistances, the resistance was measured at 300 kHz using the two-wire method.
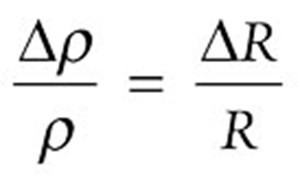
The electrical resistivity (ρ) was related to the measured electrical resistance (R), per Equation. (1) :
ρ = R/(K + GR)
where parameters K and G are based on the type of material, such as conductor, semiconductor or insulator.
Experimental studies have shown that parameter G for the smart cement was zero. Hence, the normalized change in resistivity with the changing conditions (curing, stress) can be represented as follows (Equation (2)):
In this study, the modified smart cement is represented in terms of resistivity (ρ) to the changes (composition, curing and stress), since it has been shown to be a sensitive parameter.
The 2-inch-diameter, 4-inch-high cylindrical specimen was capped and tested at a predetermined controlled displacement rate. Compression tests were performed on cement samples after one day of curing using a hydraulic compression testing machine.
Since oil well cement serves as the pressure-bearing part of wells in real applications, the piezoresistivity (change in electrical resistivity of a material under pressure) of modified (1 percent and 3 percent SBR) and unmodified cement was investigated under compressive loading.
During compression testing, electrical resistance was measured in the stress axis. To eliminate the polarization effect, alternating current resistance measurements were made using
a LCR meter at a frequency of 300 kHz.
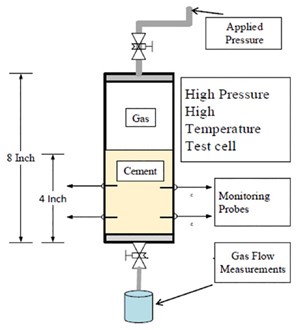
A high-pressure and high-temperature (HPHT) device was modified to measure the resistance real-time during the fluid loss for 30 min (API 13A and API 13 B) and during gas leak study (FIG. 1). The HPHT device has an area of 22.58 cm2 and can withstand a pressure of around 2,000 psi. For this study, up to 700 psi was used with the cement height of 4 inches.
Polymer modified smart cement and smart cement were placed in the device for gas migration tests, performed using nitrogen gas. During the entire test, samples cured for 30 minutes and 24 hours, and their vertical resistances were measured using the LCR device. The change in resistance was used to determine the resistivity (Eqn. (2)), which is a material property. Also, gas flow meter was used to determine the gas leak with applied pressures.
Results, Discussion
Initial resistivity was measured immediately after mixing the smart cement with and without the SBR polymer, 0.99 Ωm (TABLE 1). With the addition of 1 percent SBR, it increased 4 percent, to 1.03 Ωm – four times the amount of SBR added. With 3 percent SBR, the initial resistivity increased 12 percent, to 1.11 Ωm, also four times the amount of SBR added.
Hence, initial resistivity could be adopted as a quality control measure in the field to determine the amount of SBR added and also the quality of mixing.
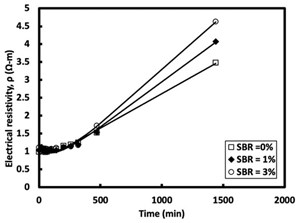
During the curing process, the resistivity rapidly changed with the time, suggesting several parameters be used in monitoring the curing (or hardening) process: initial resistivity (ρo), minimum resistivity (ρmin), time to reach the minimum resistivity (tmin), resistivity after 24 hours of curing (ρ24), and percentage of maximum change in resistivity (Resistivity Index) [RI24hr = (ρ24 – ρmin) / ρmin] × 100].
After initial mixing, the electrical resistivity reduced to a minimum value (ρmin), and then gradually increased. Time to reach minimum resistivity, tmin, can be used as an index of speed of chemical reactions and cement set times.
With the formation of large amounts of solid hydration products in the cement matrix, blocking the path, electrical resistivity increased sharply with curing time.
Finally, a relatively stable increase in trend was reached by the ions’ diffusion control of the hydration process, and resistivity increased steadily for up to 24 hours, reaching a value of ρ24hr.
Change in the electrical resistivity with respect to minimum resistivity quantifies the formation of solid hydration products, which leads to a decrease in porosity and, hence, the cement’s strength development.
The following observed trends (as summarized in TABLE 1) clearly indicate the sensitivity of resistivity to the changes occurring in the curing of cement:
- Time to reach minimum resistivity (tmin) increased by 12 percent and 38 percent when SBR polymer content was 1 percent and 3 percent, respectively.
- Minimum resistivity (ρmin) of smart cement with 0 percent, 1 percent and 3 percent SBR polymers was 0.97 Ω-m, 1.00 Ω-m and 1.05 Ω-m, respectively, an increase of 3 percent and 8 percent in minimum electrical resistivity.
- Resistivity index (RI24hr) for smart cement with 0 percent, 1 percent and 3 percent of SBR polymer was 259 percent, 307 percent and 341 percent, respectively, increasing with polymer content.
Based on experimental results, a theoretical model proposed by Vipulanandan and Paul (1990) was modified and used to predict the electrical resistivity of smart cement during hydration, up to 28 days of curing, as shown in FIGURE 2.
The Vipulanandan p-q curing model (Vipulanandan et al. 2015) is defined as follows:
(3)
where ρ: electrical resistivity (Ω-m); t is the curing time (minutes); ρmin is minimum electrical resistivity (Ω-m); tmin is time corresponding to minimum electrical resistivity (ρmin), and p1,
to and q1 are model parameters (TABLE 1).
Generally, model parameters are influenced by the composition of the cement and curing conditions (temperature, humidity, stress). In the range of variables investigated in up to 24 hours of curing, parameter q1 and t0 were influenced by the polymer content, and parameter p1 was not. Parameter t0 was influenced by the initial resistivity ρ0.
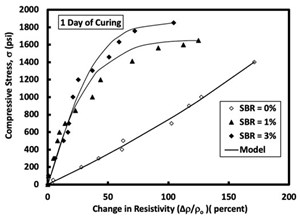
The compressive strength of the smart cement increased with the SBR polymer addition, to 1400 psi after one day of curing. With 1 percent SBR polymer, the strength increased 18 percent, to 1650 psi, and with 3 percent SBR polymer, the one-day compressive strength increased 32 percent, to 1850 psi.
It is important to characterize the sensing property, resistivity change, of the smart cement without and with polymer. For the smart cement slurry application, a compressive stress of 800 psi reduced the resistivity by 14 percent, indicating even the cement slurry is piezoresistive.
Piezoresisitive responses (stress-resistivity relationship) of the smart cement without and with polymer are shown in FIG. 3.
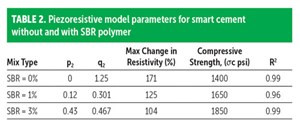
As summarized in TABLE 2:
- The piezoresistivity of the smart cement at failure after 1 day of curing (∆ρ /ρo )f was 171 percent.
- The addition of 1 percent and 3 percent SBR polymer to the smart cement decreased the electrical resistivity at failure (∆ρ /ρo )f to 125 percent and 104 percent, respectively.
- However, the smart cement with SBR polymer is piezoresistive and the responses were over 500 times the compressive failure strain (0.2 percent) of cement.
- Both parameters were sensitive to the polymer content in the smart cement model: p2 increased with polymer content, while q2 decreased.
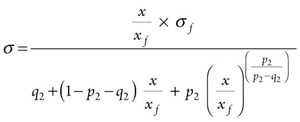
The Vipulanandan p-q piezoresistivity model, Equation (4) as follows, was used to predict the observed trends for the smart cement without and with SBR:
(4)
where σ is the stress (MPa); σf: is compressive stress at failure (MPa); x = (∆ρ /ρo ) × 100 is percentage of change in electrical resistivity due to the stress; xf = (∆ρ /ρo )f × 100 is the percentage of change in electrical resistivity at failure; ∆ρ ισ change in electrical resistivity; ρo initial electrical resistivity (σ = 0 MPa), and p2 and q2 are piezoresistive model parameters.
Gas Leak
Tests were performed to investigate the sensing characteristics of the smart cement during a gas leak.
Maximum pressure gradient of 2100 psi/ft was used in this study. The pressure gradient was increased, and the discharges were measured using the HPHT test facilities (FIG. 1). The resistance changes were monitored continuously during the test.
The smart cement without and with 3 percent polymer was tested for gas leaks after 1 hour and after 24 hours of curing.
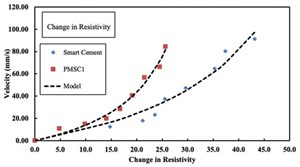
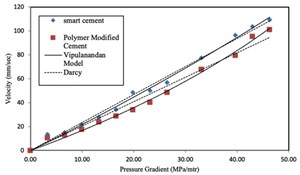
In FIGURE 4, the discharge velocity (volume discharge per unit area) for smart cement without and with 3 percent polymer is compared for one-hour cured specimens. Polymer addition reduced the discharge velocity of gas at all the pressure gradients tested, with a maximum reduction of about 18 percent. The velocity of discharge and pressure gradient relationship was non-liner and, hence, Darcy’s Law cannot be used.
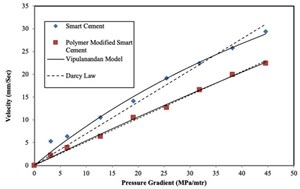
In FIGURE 5, the gas leak velocities with pressure gradients are compared for 2- hour cured smart cement without and with 3 percent polymer and the relationship was non-linear. With 3 percent polymer, the maximum gas velocity reduction was about 33 percent.
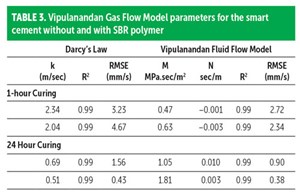
To quantify the gas leak (average discharge per unit area = V) occurring in cement at different pressure gradients (i) and curing time, the new Vipulanandan Fluid Flow Model, Equation (5), is represented as follows:
V = i / (M + Ni) (5)
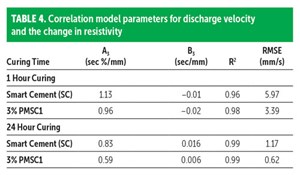
Model parameters M and N are summarized in TABLE 3, with the coefficient of determination and root-mean square error (RMSE). The Vipulanandan Fluid Flow Model predictions are compared to the experimental results of Darcy’s model in FIGURE 4 and FIGURE 5. Predictions were very good based on RMSE and the model parameters are summarized in TABLE 4.
In the 1-hour cure, the gas leak increased resistivity 45 percent for the smart cement and 25 percent for the 3 percent polymer slurry, as shown in FIGURE 6.
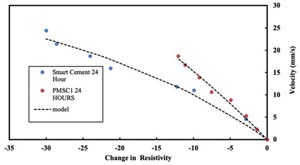
For hardened cement, the trends were opposite. With added pressure, resistivity increased by 80 percent, for compressive stress of 700 psi (FIGURE 3), but with the gas leak, resistivity reduced by –35 percent, as shown in FIGURE 7. This is a clear indication of the sensing characteristic of smart cement.
In smart cement with 3 percent polymer, the maximum resistivity change was –12 percent. By monitoring the resistivity change, the gas migration in cement can be detected and quantified.
The Vipulanandan correlation model was used to relate the discharge velocity (V = average discharge per unit area) to the change in resistivity as follows, in Equation (6):
V= x /(A3 + B3 × x) (6)
where x = Piezoresistive Axial Strain (∆ρ /ρo ) percent.
The model parameters A3 (sec percent/mm) and B3 (sec/mm) are summarized in TABLE 4.
Conclusions
Based on the experimental and analytical study on smart cement without and with 1 percent and 3 percent SBR polymer addition, the following conclusions are advanced:
- Adding SBR polymer increased the resistivity of the smart cement: 4 percent with the 1 percent polymer; 12 percent with 3 percent polymer. Hence, resistivity could be a good quality control parameter in the field. The Vipulanandan curing model predicted the trends very well.
- Addition of polymer increased the compressive strength of smart cement, after 24 hours of curing, by 32 percent with the 3 percent polymer.
- The polymer addition made the smart cement piezoresisitive. With 3 percent polymer, the resistivity change at peak stress was more than 100 percent after 24 hours of curing. Vipulanandan p-q Piezoresisitive Model predicted the behavior very well.
- Addition of polymer reduced the gas leak. Smart cement resistivity changes were highly sensitive to the gas leak and can be used to detect and quantify gas leaks.
COMPOSITE COATINGS TO PROTECT REINFORCED CONCRETE IN SALT-WATER ENVIRONMENT
Corrosion in reinforced concrete structures is raising increasing concern because it requires immediate repairs and rehabilitation to extend the service life of the structures.
One of the methods to stop the ingress of corrosion-causing agents is by constructing a barrier on the concrete surface using a suitable coating or sealer. A coating forms a film on the surface and blocks the pores and cracks on the concrete surface, whereas sealers penetrate the concrete and make its surface hydrophobic
However, most sealers are not permanent, requiring periodic re-applications. To provide long-term durability, another CIGMAT study investigated the effectiveness of combining sealers with coating to protect reinforced concrete from chloride and moisture intrusion in salt water.
Materials/Methods
Different combinations of three coating materials were applied to the concrete substrate.
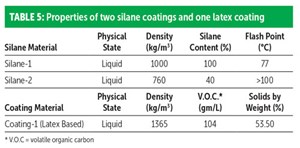
Coating-1 was a water-based latex, with rapid drying, good adhesion, and high flexibility.
Two commercially available silane coatings were:
- Silane-1, a micro-emulsifiable concentrated alkoxysilane, with typical dilution of 9 parts water to 1 part silane (volume based).
- Silane-2, a clear, penetrating, breathable and water-repellent version designed to protect the exterior above-grade concrete.
Some of the properties of these materials are summarized in TABLE 5.
Materials/Methods
Obtained from an onsite concrete batch plant used for constructing a bridge across a causeway near the coastline, 6-inch diameter by 6-inch height concrete specimen cylinders had an average unit weight (based on 20 specimens) of 140.2 pcf, standard deviation of 0.9 pcf, COV (coefficient of variation) of 0.64 percent, and average compressive pulse velocity of 13,353 ft/sec (4070 m/s).
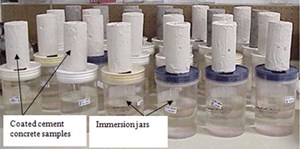
Procedures were developed for preparing various combinations of specimens and evaluating their protection of reinforced concrete during immersion (wetting phase) for 21 days and exfiltration/breathing (drying phase) for 21 days.
Measured the changes in weights under the wetting and drying testing conditions, to assess degree of deterioration, and modeled performance of the various composite coatings.
In the wetting phase, specimens were totally immersed in one of two test solutions: tap water (pH = 7 to 9) and 15 percent NaCl solution, which represents the accelerated test condition in marine system, as recommended by NCHRP 244 (National Cooperative Highway Research Program Report).
The 21-day drying phase was under room condition of 23 degrees C and 55 percent relative humidity (FIGURE 8).
Results, Discussion
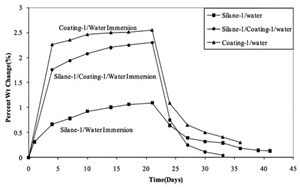
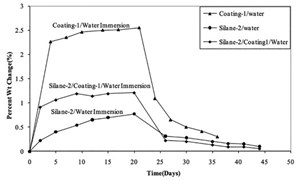
The relationships between the percent weight change and time for coated specimens in water are shown in FIGURES 9 and 10 for silane-1 and silane-2 respectively.
In the first four days, based on the observed weight changes with time, there was infiltration, followed by diffusion of the water into the coated specimens.
Test results are also summarized in TABLE 6:
- The average weight increase in water after 21 days, for specimens coated with Silane-1 was 1.1 percent as compared to 0.7 percent for specimens coated with Silane-2.
- Weight increase for specimens coated with Silane-1/Coating-1 combination was 2.3 percent, compared to 1.21 percent for Silane-2/Coating-1 combination.
- Maximum weight gain was observed for specimens coated with Coating-1, compared with any other combination. This implies that Coating-1 absorbed more water and governed the water intake for cases where Coating-1 was the outer layer.
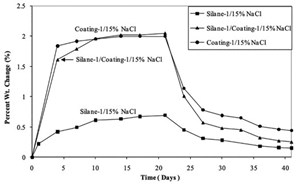
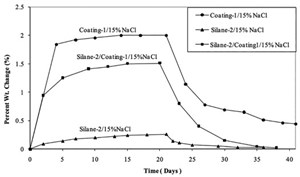
In the 1.5 percent NaCl solution, relationships between the percent weight change and time for coated specimens are shown in FIGURES 11 and 12 for Silane-1 and Silane-2, respectively. The same weight changes were observed in the first four days, as in the water wetting phase.
Test results are also summarized in TABLE 7:
- Weight increase in 15 percent NaCl solution after 21days, for specimens coated with Silane-1 was 0.7 percent, compared to 0.2 percent for specimens coated with Silane-2.
- Similarly, weight increase for specimens coated with Silane-1/Coating-1 combination was 2.1 percent, compared to 1.5 percent for Silane-2/Coating-1 combination.
- Weight gain of specimens coated with Coating-1 was similar to the Silane-1/Coating-1 combination, which reinforces the fact that Coating-1 governed the solution uptake where it was used.
- However, the Silane-2/Coating-1 combination was more effective in resisting the solution intake in all cases, compared to Silane-1/Coating-1 combination.
Results of the drying phase are compared in FIGURES 2, 3, 4 and 5. Most of the weight changes were observed during the first six days, when the testing water and salt solutions evaporated. Residual solution at the end of the drying phase reduced to zero for the Silane-1/ Coating-1 combination, compared to 0.05 percent for the Silane-2/Coating-1 combination, when immersed in water.
However, Silane-2 with Coating-1 proved to be a better combination than Silane-1 with Coating-1, when immersed in 15 percent NaCl solution, as it drained out all the solution at the end of the drying phase.
Corrosion of reinforced concrete is very much influenced by the diffusion phase (long-term); hence, the immersion process should govern the selection of the coating type to be used for protecting structures.
Conclusions
Applicability of two commercially available silanes, combined with a latex-based coating, in resisting absorption of water and 15 percent NaCl solution was investigated. The following conclusions are advanced:
- A relatively quick test method (21 days of immersion followed by 21 days of drying) was effective in identifying
the differences in performance. - Silane-2 alone preformed the best in water and in the 15 percent NaCl solution, clearly identifying its use with reinforced concrete piles and columns in the causeway bridge along the coast.
- Based on analyses of the results, just the immersion test can be used to evaluate the performance of coatings for concrete under different environments.
COVID-19 Virus Impact
Illustrating the breadth of CIGMAT research, this study investigated the trends and impact of the COVID-19 virus around the world and in the United States over 18 months (April 2020 to September 2021), especially related to Gross Development Product (GDP).
Based on the analysis of data from various sources, CIGMAT reached the following conclusions:
With more than 800,000 deaths, the United States was the worst impacted nation.
Confirmed COVID-19 cases and death rates peaked in January 2021 around the world and in the U.S. The vaccine has reduced the rate of death in the U.S. since January 2021.
Focusing on CIGMAT’s home and initially, the worst-affected state, New York’s death rate peaked in April 2020, at 21.1K/m and the Texas death rate peaked in January 2021, at 9K/m. Texas and New York had the highest cases per month in January 2021, consistent with the U.S. and world trends.
COVID-19 had a negative impact on the 2020 GDP around the world, which dropped 3.3 percent in the first three quarters of 2020. In the U.S, there were GDP losses in 49 states, ranging from 3.6 percent to 8.8 percent. Only Utah showed a gain – of 0.1 percent–in that time period.
While predominantly negative, COVID-19 also had positive impacts on the economy of the world. In advanced economies, the top positive impacts were government responsiveness to change, followed by internal collaboration within companies.






Comments