October 2019 Vol. 74 No. 10
Features
Utility & Communications Construction Update
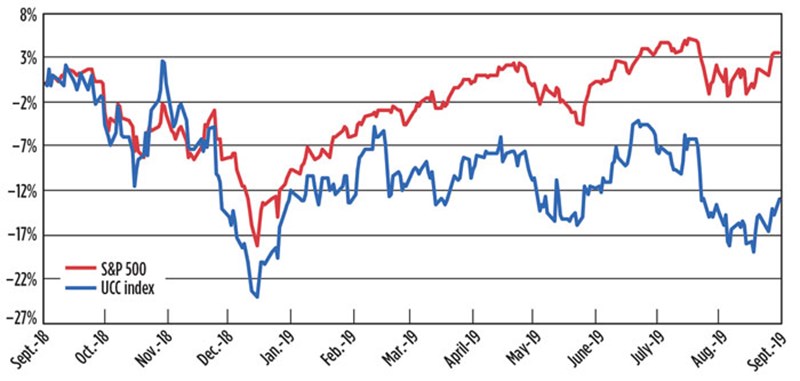
The summer construction season of 2019 saw further decline for the Utility & Communications Construction Index (UCCI) companies relative to the S&P 500. From June through September, the S&P 500 is up over 3 percent, while the UCCI had declines of approximately 1.4 percent.
A host of factors contributed to this. The tariffs placed on goods manufactured in China have an impact on the cost of equipment and materials, oil prices were at their lowest levels since January, natural gas prices bottomed out, and economic concerns around housing signaled a slow-down in residential construction.
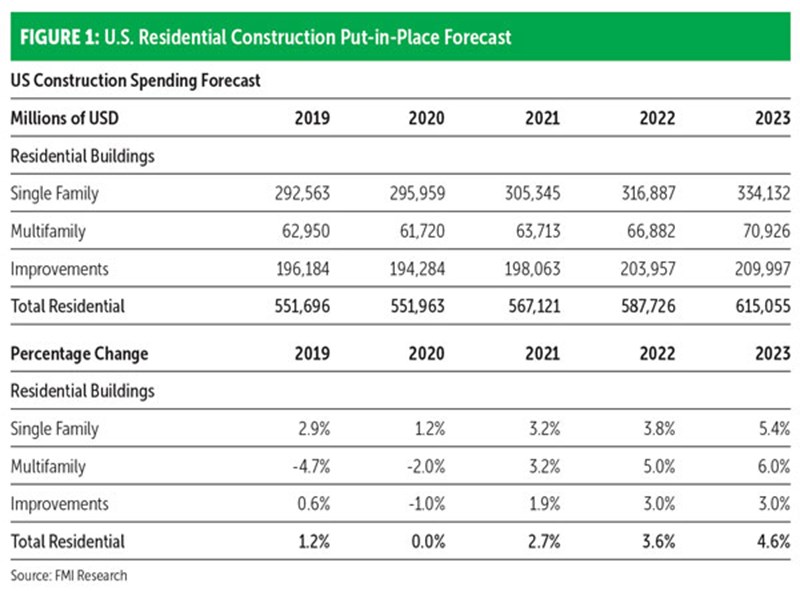
While there is significant utility construction related to the repair and replacement of existing infrastructure, both wet and dry utility contractors benefit from the installations of utility and communication infrastructure required for new homes. As FMI looks to 2020, contractors with significant exposure to the new-build markets may need to look internally to ensure they are prepared with a variable-cost structure and strong backlog to weather a slow-down in the growth of single-family homes.
Economists cite two major reasons for the potential decline in residential construction. The Fannie Mae Economic and Strategic Research Group suggested that the rising federal funds rate by the Federal Reserve is having a detrimental impact on willingness to buy. As the cost of borrowing increases, it is more difficult for a buyer to meet the expectations of a seller for the value of a home. While the Federal Reserve is executing relatively conservative rate hikes, the increased cost of debt is, nonetheless, impactful to the housing market.
The second primary concern is the population growth in the United States. According to Bill Conerly, a Forbes contributor, housing is built to accommodate new residents and, particularly, new families. U.S. population growth in 2018 was the lowest since 1937, and a “new normal” of average housing starts is likely to be between 1.1 and 1.2 million, versus the 1.5 million the market is accustomed to. FMI research projects that single family put-in-place will slow growth in 2019, and that both multifamily and residential improvements will experience a decline, resulting in a stagnant residential construction market.
Even with these pressures, a slowdown is all that is expected in the current market. Income and hours continue to rise, U.S. home prices are up almost 5 percent over the year prior, and the supply and demand appear to be close to neutral. For those organizations with significant residential exposure, we view this pause in the market as a period for taking a breath and making some important decisions. That includes hard performance and personnel decisions, refining a strategy for long-term success and, most importantly, maintaining a healthy balance sheet by avoiding overextension on new or larger projects.
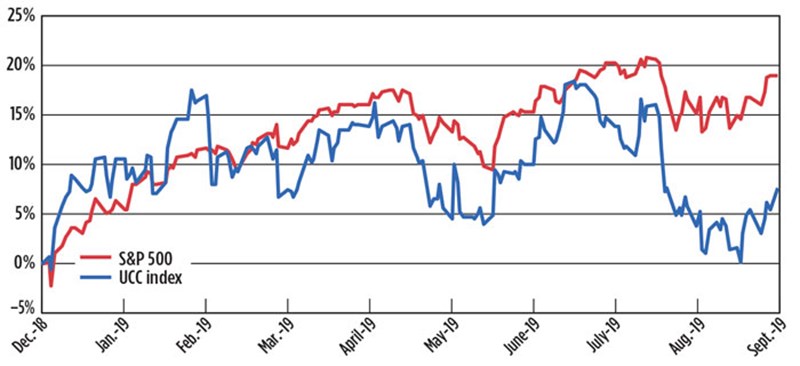
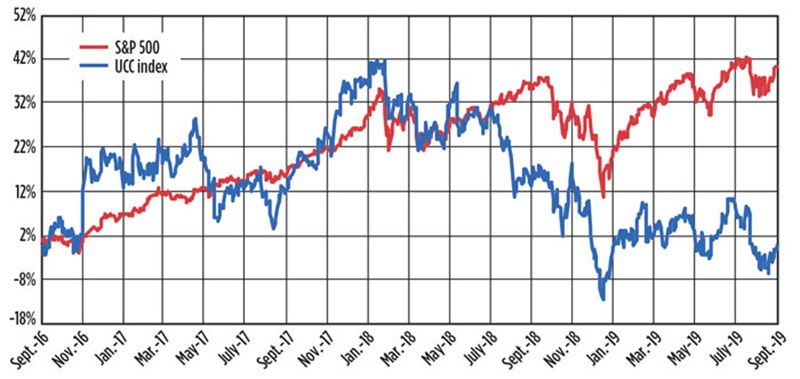
The UCCI presented, below, shows the performance of the sector’s publicly traded stocks year-to-date (Figure 2), the past 12 months (Figure 3) and the past three years (Figure 4). The year-to-date performance experienced a sharp drop, relative to the performance of the S&P 500, due to the decline in oil prices and ongoing concerns of material and equipment cost increases related to the Chinese trade relations. The results are depressed stock prices compared to other segments of the market. Revenue is higher year-over-year for the UCCI companies; however, profitability must continue to improve for the segment to outperform.
The UCCI remains more volatile than the S&P 500. Figures 3 and 4 illustrate the declining performance of the UCCI, while the S&P 500 was stable. Most of the declines in the UCCI are correlated with oil pricing.
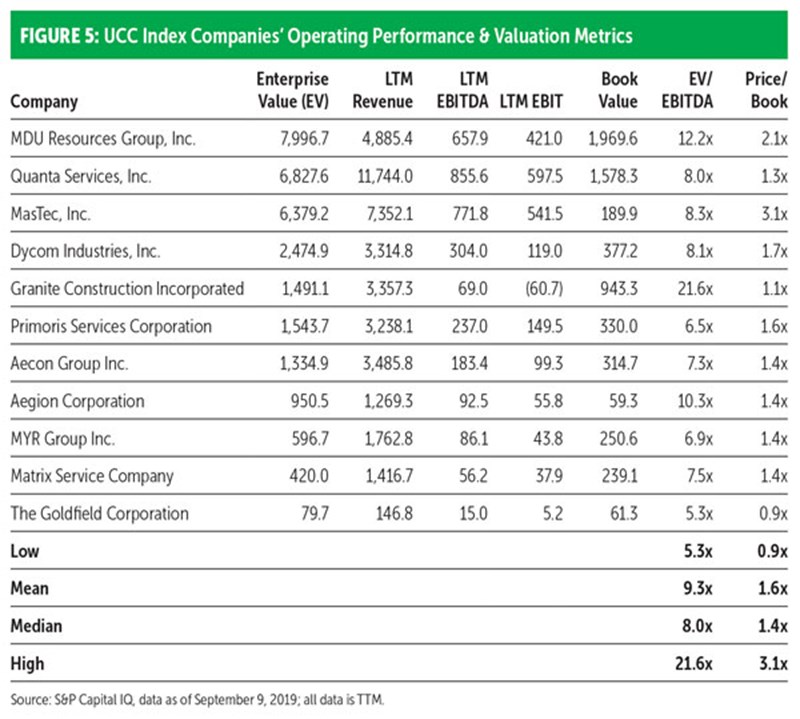
As we look at valuation, the worth of companies within the UCCI have varied significantly based upon backlog, operating performance and exposure to select end markets. Valuation declined further this quarter, triggering the first set of stock buybacks from companies within the UCCI. This generally means that management’s outlook is greater for a given company than the market’s current pricing of the stock.
This is typically a good sign for the health of the underlying industry and could signal the beginning of a rise in value for the UCCI companies. Valuation will be influenced by macroeconomic factors in the next two quarters as trade discussions in North America and with China play out. In addition, the Federal Reserve has slowed rate increases and could reverse course, if the economy slows, to boost market activity.
A major development in the utility and communications infrastructure space occurred at the beginning of September, when a definitive agreement was signed between J2 Acquisition Limited and APi Group Inc. for approximately $2.9 billion. The newly formed company is expected to be listed on the New York Stock Exchange under the symbol APG. While it has strong capabilities in life safety and industrial services, APG also performs significant utility and communications construction and will be a new member of the UCCI companies, once the listing is finalized.
Also in September, Quanta Services Inc. acquired The Hallen Construction Company, based in New York City. One of Quanta’s largest investments in the Northeast, Hallen will give the Houston-based company a very strong presence in the New York gas and civil markets. •



Comments